Method and system for optimizing product inventory cost and sales revenue through tuning of replenishment factors

a technology of product inventory cost and factor, applied in the field of methods and systems for optimizing product inventory cost and sales revenue, can solve the problems of no comprehensive method available to predict the impact of replenishment lever on service level, loss of sales, or on shelf availability of retailers,

Inactive Publication Date: 2015-01-29
TERADATA
View PDF40 Cites 19 Cited by
  • Summary
  • Abstract
  • Description
  • Claims
  • Application Information

AI Technical Summary

Benefits of technology

The patent text describes a method and system for optimizing the cost and sales revenue of a retailer's replenishment policies. The technical effect of this patent is the ability to predict the impact of replenishment levers on service level, lost sales, and on shelf availability of the retailers, which has previously been an inability for replenishment experts to do. This methodology can help retailers better understand and optimize their replenishment policies, leading to improved profitability.

Problems solved by technology

Optimizing the replenishment policies is a paramount problem for the largest retailers in the world.
a. Impact on Inventory Cost: the amount of inventory carried, which includes the cost of storage, capital, insurance and labor.
b. Impact on Sales Revenue: replenishment levers indirectly impact the on-shelf-availability of the products, and hence the service level and lost sales.
However, to date, there has been no comprehensive method available to predict the impact of replenishment levers on service level, lost sales, or on shelf availability of the retailers.
As a result, retailers are currently capable of quantifying the cost of their replenishment policies, but are unable to identify the corresponding upside, or the revenue impact of their policies.
This has of course led to an inability of replenishment experts to mathematically model and optimize replenishment policies for retail businesses.

Method used


Image

  • Method and system for optimizing product inventory cost and sales revenue through tuning of replenishment factors
  • Method and system for optimizing product inventory cost and sales revenue through tuning of replenishment factors
  • Method and system for optimizing product inventory cost and sales revenue through tuning of replenishment factors

Examples


Embodiment Construction

[0028]Modeling the demand distribution is at the core of the new methodology. By modeling the demand distribution for the duration of an inventory cycle, i.e., the time between receiving two shipments at store, and cross-joining the demand distribution against the available on-shelf inventory, it is possible to determine potential lost sales or service level.

[0029]FIG. 4 shows the density 401 and cumulative distribution 403 of demand for a given category of products. Cross joining the demand distribution curves against number of units of available on shelf inventory results in the sales metrics such as In-stock %, Service Level and Lost Sales.

[0030]Demand density curve 401, plotted against the left axis, Frequency (%), illustrates the relative likelihood for the demand variable to take on a given value. Cumulative distributive curve 403, plotted using the right axis, Cumulative Frequency, shows the probability that the demand variable will be less than or equal to a specified value....


PUM


Abstract

A method and system for predicting the impact of replenishment levers on product service level, lost sales, and on-shelf availability for a retailer. The method and system models cost and revenue elasticity curves for a product or group of products and analyzes the cost and revenue elasticity curves, measures the impact of tuning the replenishment levers on inventory cost and sales revenue, and identifies values for the product replenishment levers to optimize replenishment system policies and product profitability.

Description

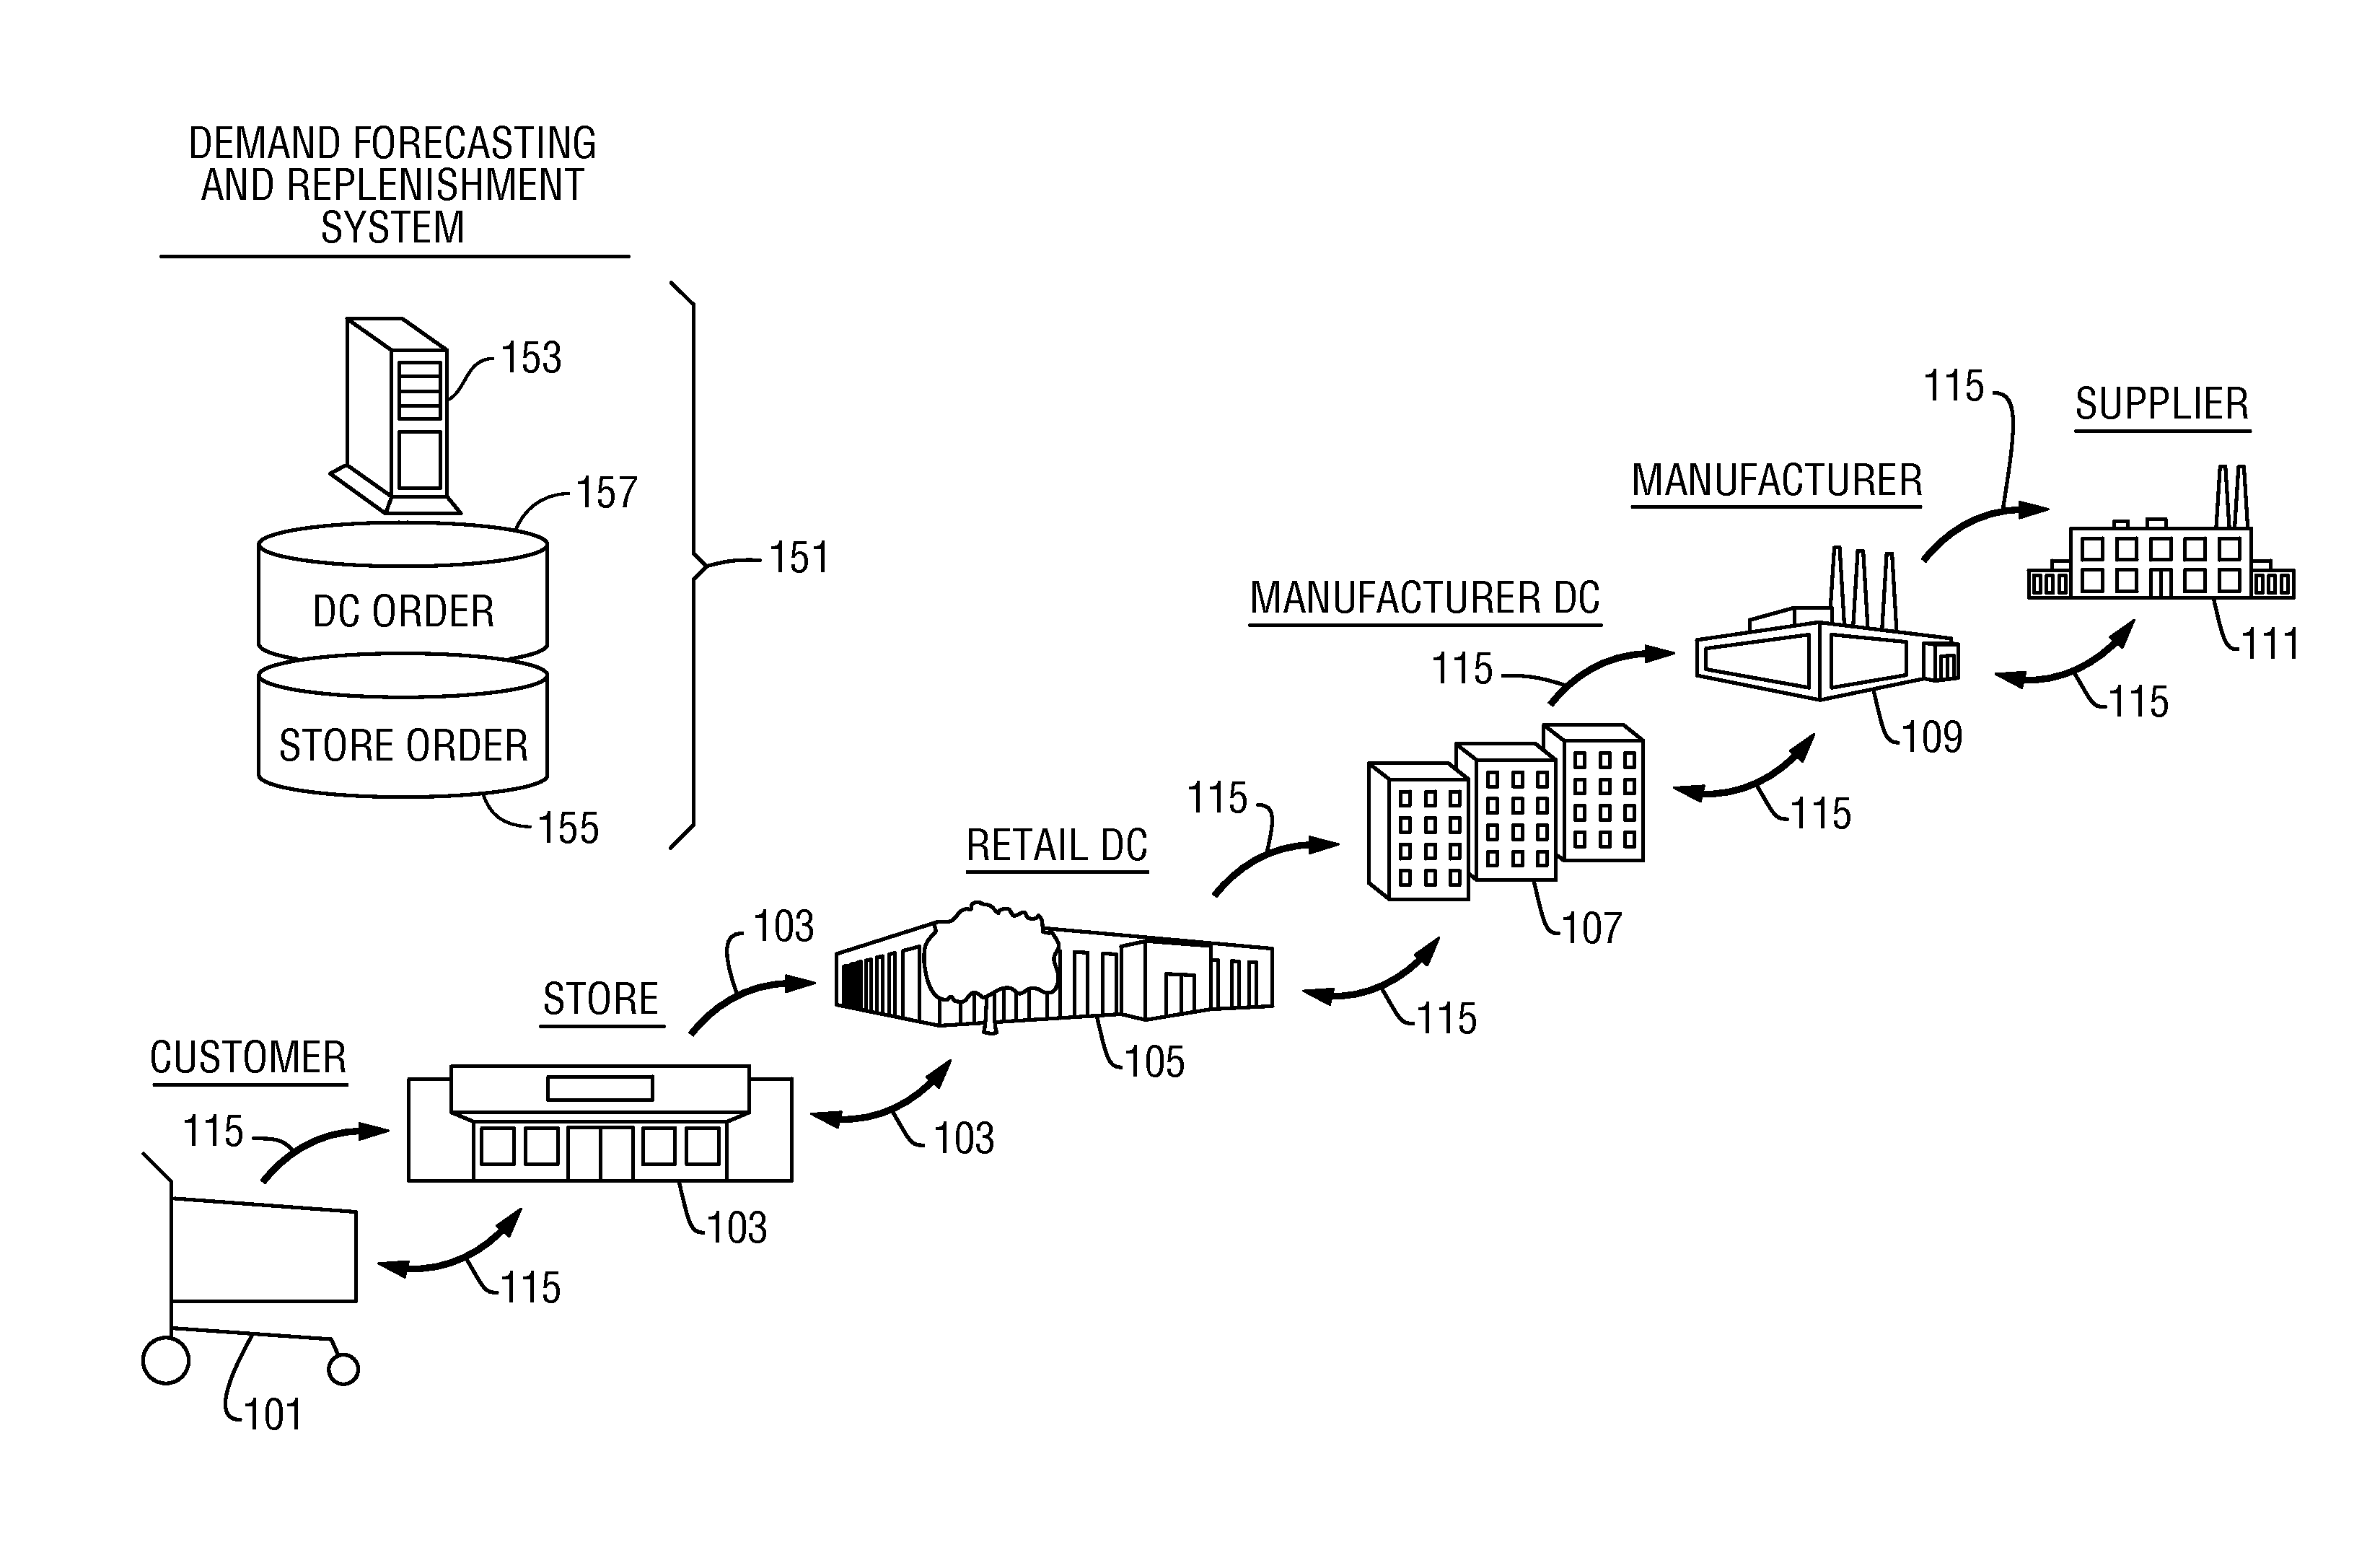
CROSS REFERENCE TO RELATED APPLICATIONS[0001]This application claims priority under 35 U.S.C. §119(e) to the following co-pending and commonly-assigned patent application, which is incorporated herein by reference:[0002]Provisional Patent Application Ser. No. 61 / 858,912, entitled “METHOD AND SYSTEM FOR OPTIMIZING PRODUCT INVENTORY COST AND SALES REVENUE THROUGH TUNING OF REPLENISHMENT FACTORS,” filed on Jul. 26, 2013, by Arash Bateni.FIELD OF THE INVENTION[0003]The present invention relates to methods and systems for optimizing product inventory cost and sales revenue.BACKGROUND OF THE INVENTION[0004]FIG. 1 provides an illustration of a retail demand / supply chain from a customer 101 to a retail store 103, retail distribution center / warehouse 105, manufacturer distribution center / warehouse 107, manufacturer 109 and supplier 111. Arrows 115 are used to illustrate communication between the demand / supply chain entities. A demand forecasting and replenishment system, identified by refere...

Claims


Application Information

Patent Timeline
IPC IPC(8): G06Q30/02G06Q10/06
CPCG06Q10/067G06Q30/0206
Inventor BATENI, ARASH
Owner TERADATA
Why Eureka
Try Eureka