
Power curve correlation system

a power curve and correlation system technology, applied in the field of power curve correlation system, can solve the problems of insufficient time for power system engineers to correlate, categorize and understand the large amount of historical data, and the development and persistence of inaccuracies in the conventional load forecast model

Active Publication Date: 2013-07-04
GENERAL ELECTRIC CO
View PDF9 Cites 32 Cited by
  • Summary
  • Abstract
  • Description
  • Claims
  • Application Information

AI Technical Summary

Benefits of technology

This patent is about a system and method for verifying a prediction of power network load for a component. It involves analyzing data on the load of the component over a period of time and identifying patterns in the data. These patterns are then grouped together and categorized based on their recurring occurrence. This categorized data, along with information about the predicted load, is used to verify the accuracy of the prediction. The technical effects of this invention include improved accuracy in predicting power network load and improved reliability in power network planning and management.

Problems solved by technology

As a result, the power system engineers spend much of their time reviewing the load forecast model and comparing the historical load data and the forecasting results.
These large data quantities and extensive review times may lead to the development and persistence of inaccuracies in the conventional load forecast models.
More specifically, the power systems engineer does not have sufficient time to correlate, categorize and understand the large amount of historical data prior to verifying the accuracy of the load forecast models.
If all of the historical data is not correlated, categorized and understood, inaccuracies in the load forecast model will not be identified, and the load forecast model will be defective.
When a defective load forecast model does not accurately predict a necessary power network load, the power network's load supply is inadequate and will result in a power network problem (e.g., failure, power outages, etc.).

Method used


Image

  • Power curve correlation system
  • Power curve correlation system
  • Power curve correlation system

Examples


Embodiment Construction

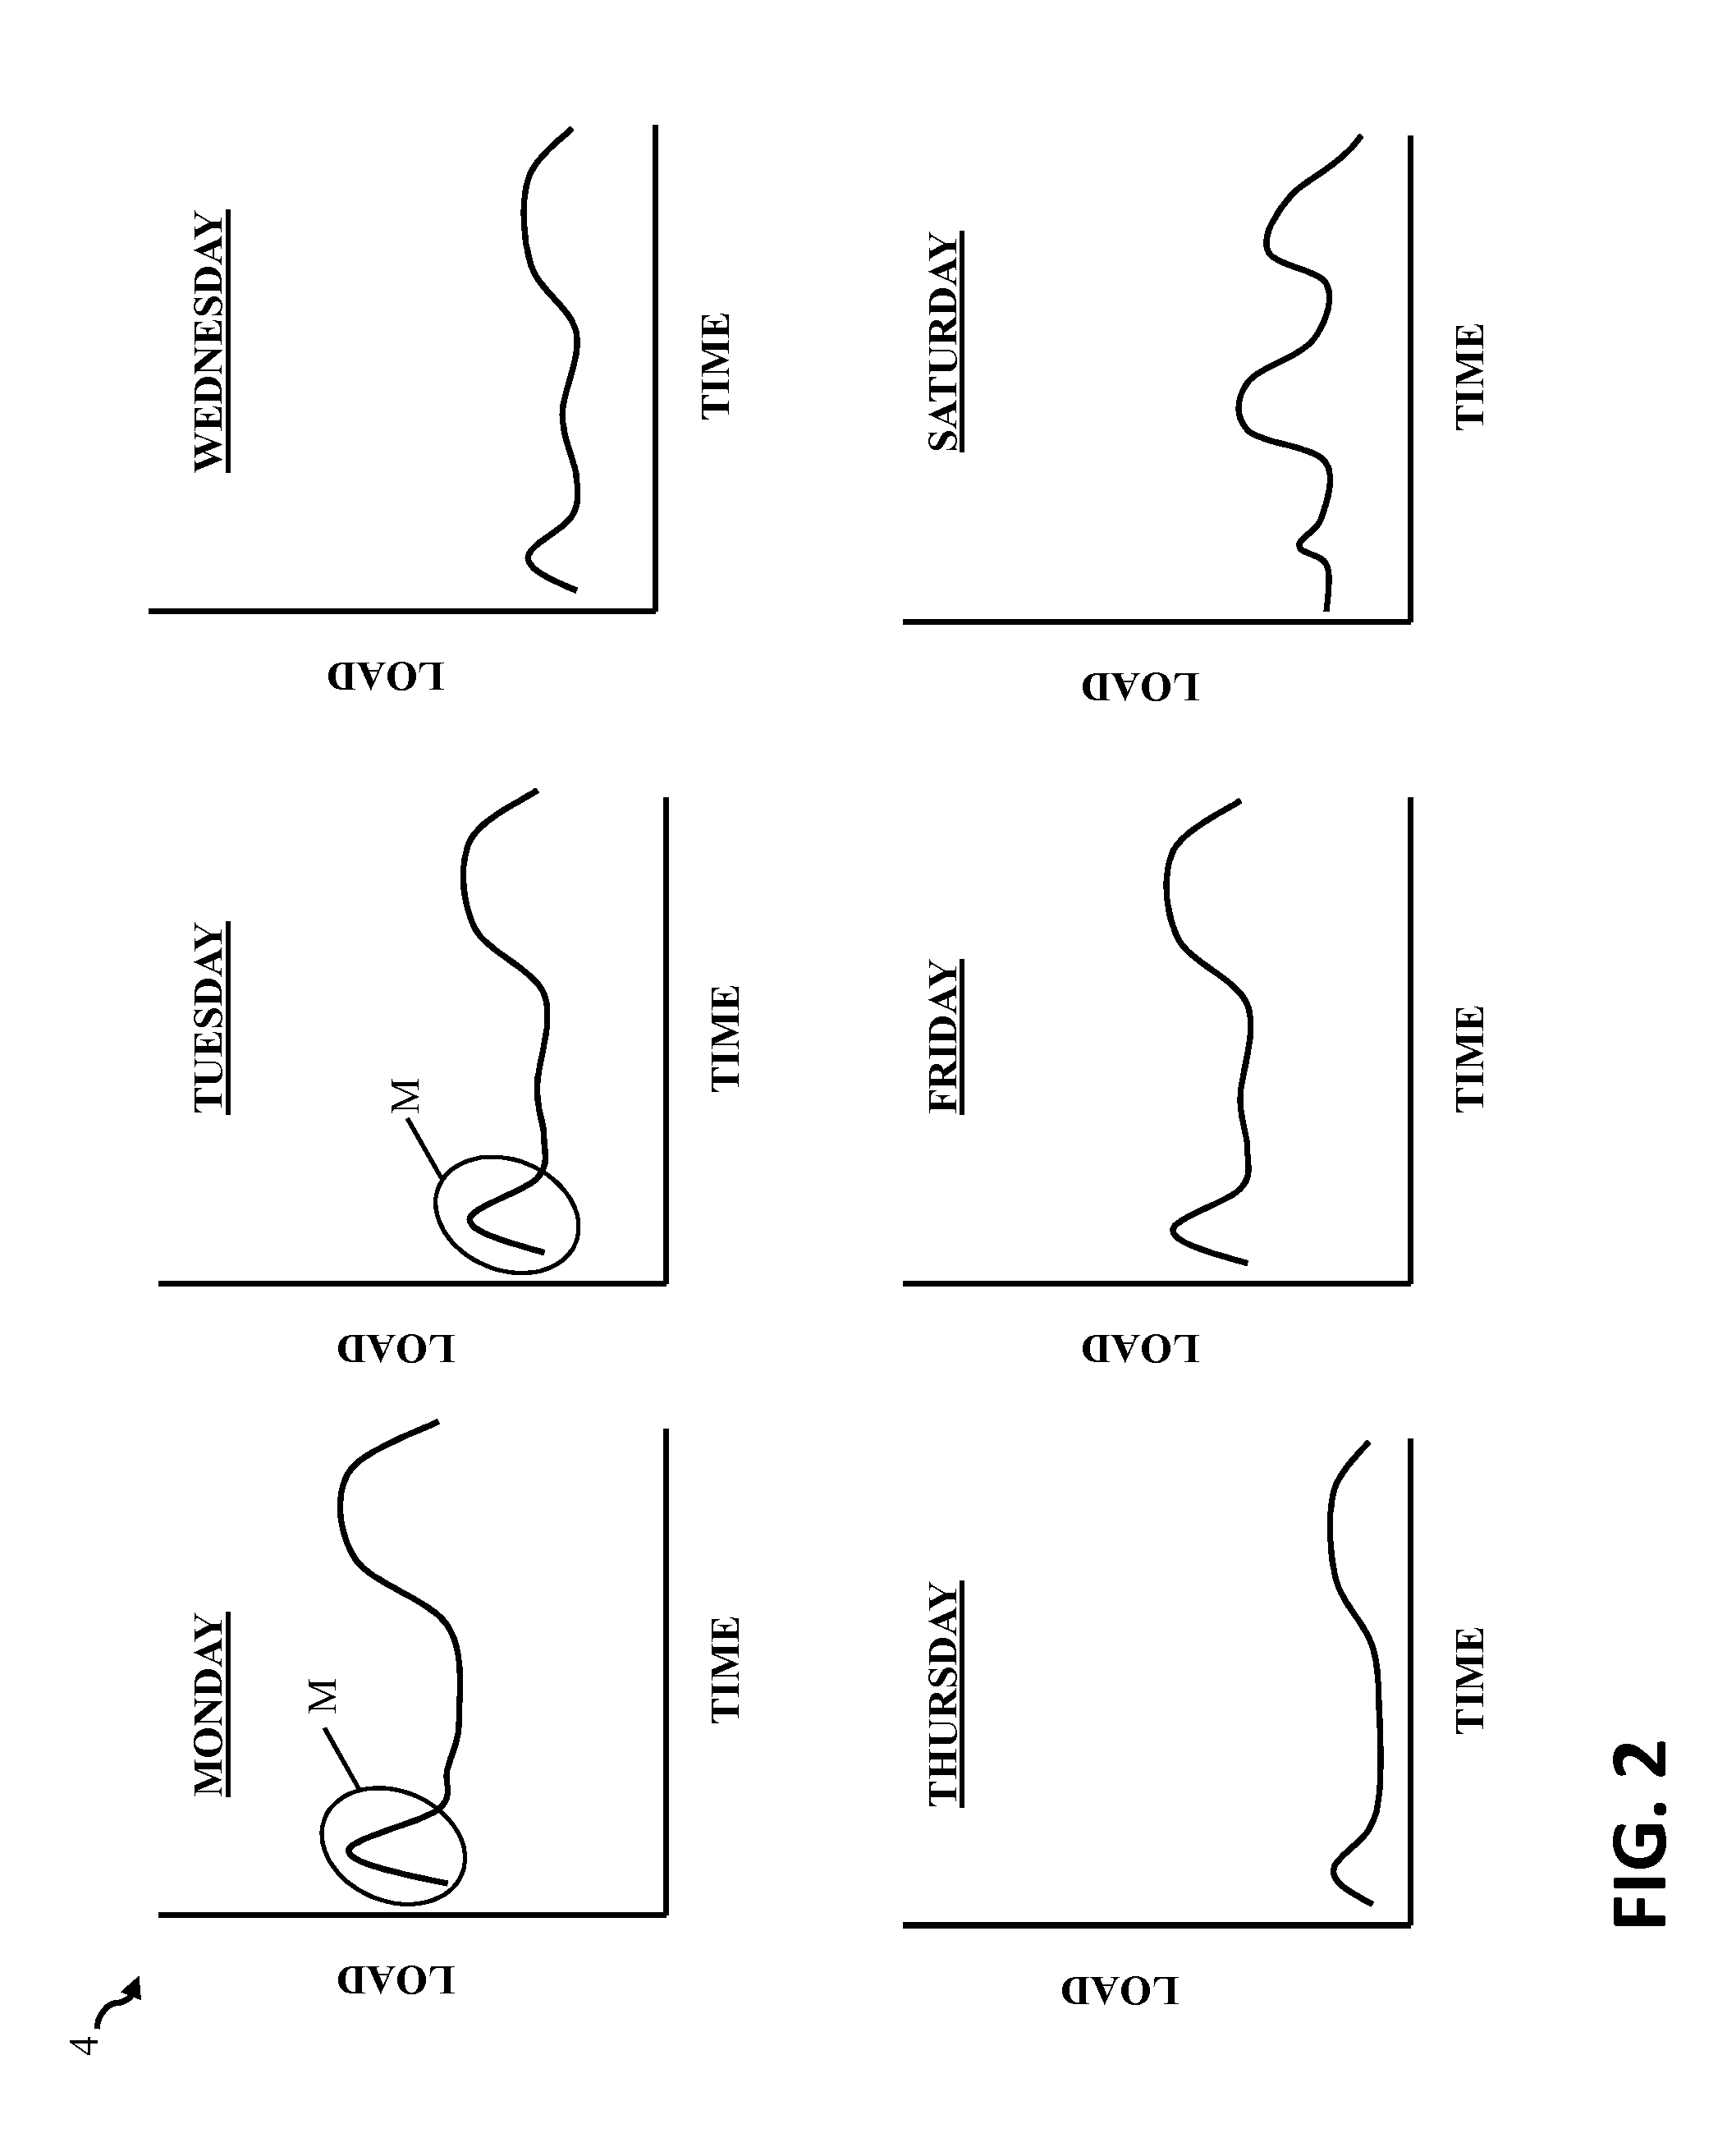
[0012]As described herein, aspects of the invention relate to a power curve correlation system. Specifically, as described herein, aspects of the invention relate to a system for correlating and organizing the load data of a power supply system (e.g., power grid, smart grid, etc.), to provide more accurate load forecast models.

[0013]Load forecast models aid power supply companies in maintaining proper operation and accurately anticipating future power demands. More specifically, load forecast models can provide anticipated power usages for given times of day, year, etc., that are provided by a power supply system. Power supply companies rely on forecasting models to determine whether anticipatory measures are necessary in order to maintain a power supply to users. Generally, power system engineers (PSE) verify the accuracy of conventional load forecast models by reviewing large amounts of historical load data and comparing the historical data to the conventionally created load forec...


PUM


Abstract

A power curve correlation system is disclosed. The power curve correlation system includes a system including: at least one computing device configured to verify a forecast of a power network load for a component by performing actions including: obtaining a set of load data for the component in the power network over a period; identifying similar load patterns in the set of load data using a pattern recognition technique, independent of at least one of: a scale for a component load, a minimum component load value or a maximum component load value; grouping the identified similar load patterns into distinct groups; categorizing at least one of the distinct groups according to a recurring event associated with a load pattern in the at least one distinct group; and providing the categorized group for verifying the forecast of the power network load for the component using the at least one categorized group.

Description

BACKGROUND OF THE INVENTION[0001]The subject matter disclosed herein relates generally to a power curve correlation system. Specifically, the subject matter disclosed herein relates to a system for correlating and organizing the load data of a power supply system (e.g., power grid, smart grid, etc.), to provide more accurate load forecast models.[0002]Load forecast models aid power supply companies in maintaining proper operation and accurately anticipating future power demands. More specifically, load forecast models can provide anticipated power usages for given times of day, year, etc., that are provided by a power supply system. Power supply companies rely on forecasting models to determine whether anticipatory measures are necessary in order to maintain a power supply to users. Generally, power system engineers (PSE) verify the accuracy of conventional load forecast models by reviewing large amounts of historical load data and comparing the historical data to the conventionally...

Claims


Application Information

Patent Timeline
Patent Type & Authority Applications(United States)
IPC IPC(8): G06F19/00
CPCH02J3/00G06Q30/0202G06Q50/06H02J2003/003Y04S50/14G01R31/2642G01R1/203Y04S10/54G01R19/0092H02J3/003Y04S10/50
Inventor MCDONALD, JASON LOUISALDERSON, WILLIAM MICHAELGREY, AUDLEY
Owner GENERAL ELECTRIC CO
Learn More