Method for displaying changes in parameter values

Inactive Publication Date: 2011-02-17
ABB TECH AG
View PDF5 Cites 0 Cited by
  • Summary
  • Abstract
  • Description
  • Claims
  • Application Information

AI Technical Summary

Benefits of technology

[0012]On a given display, two successive sampled values of, in each case, two parameter values can be represented as oppositely directed vectors with a common origin on, and orthogonally to, a dividing line, which divides the display into two component areas. More recent sampled values and older (i.e., earlier) sampled values of each of plural parameters can each be plotted together on opposite sides of the dividing line on the same component area. That area which is enclosed by the dividing line and the connecting lines between the respectively older sampled value of a parameter value and the respectively more recent sampled value of the other parameter value can be represented in a highlighted form.
[0013]This resulting area can be triangular for all the parameter values which are different from zero, and the area points away from the dividing line in the form of an arrow. The tip of the arrow is formed by the point of intersection of the connecting lines between the respectively older sampled value of one parameter value and the respectively more recent sampled value of the other parameter value.
[0014]If the tip of the arrow is located in the component area of the more recent sampled values, the correlated trend of the two parameter values under consideration is rising. On the other hand, if the tip of the arrow is located in the component area of the older sampled values, the correlated trend of the two parameter values under consideration is falling. The area content of the enclosed area can be a measure of the weight of the trend.
[0015]In this context, a complex relationship of the correlated linking of two time profiles can be displayed with simple geometric means having low computing requirements.
[0016]According to an exemplary embodiment of the disclosure, each highlighted area is represented in a signal color.
[0019]This can increase the visual perceptibility of the trend direction of the correlated trend.

Problems solved by technology

The derivation of a correlated trend from a plurality of discrete time profiles by subjective comparison of discrete graphics can be susceptible to errors and gives rise to non-reproducible results.
The precise evaluation of the time profiles with statistical methods and subsequent graphic display require a large amount of expenditure on computing, which is not available, in particular in loop-fed automation equipment.

Method used


Image

  • Method for displaying changes in parameter values
  • Method for displaying changes in parameter values
  • Method for displaying changes in parameter values

Examples


Embodiment Construction

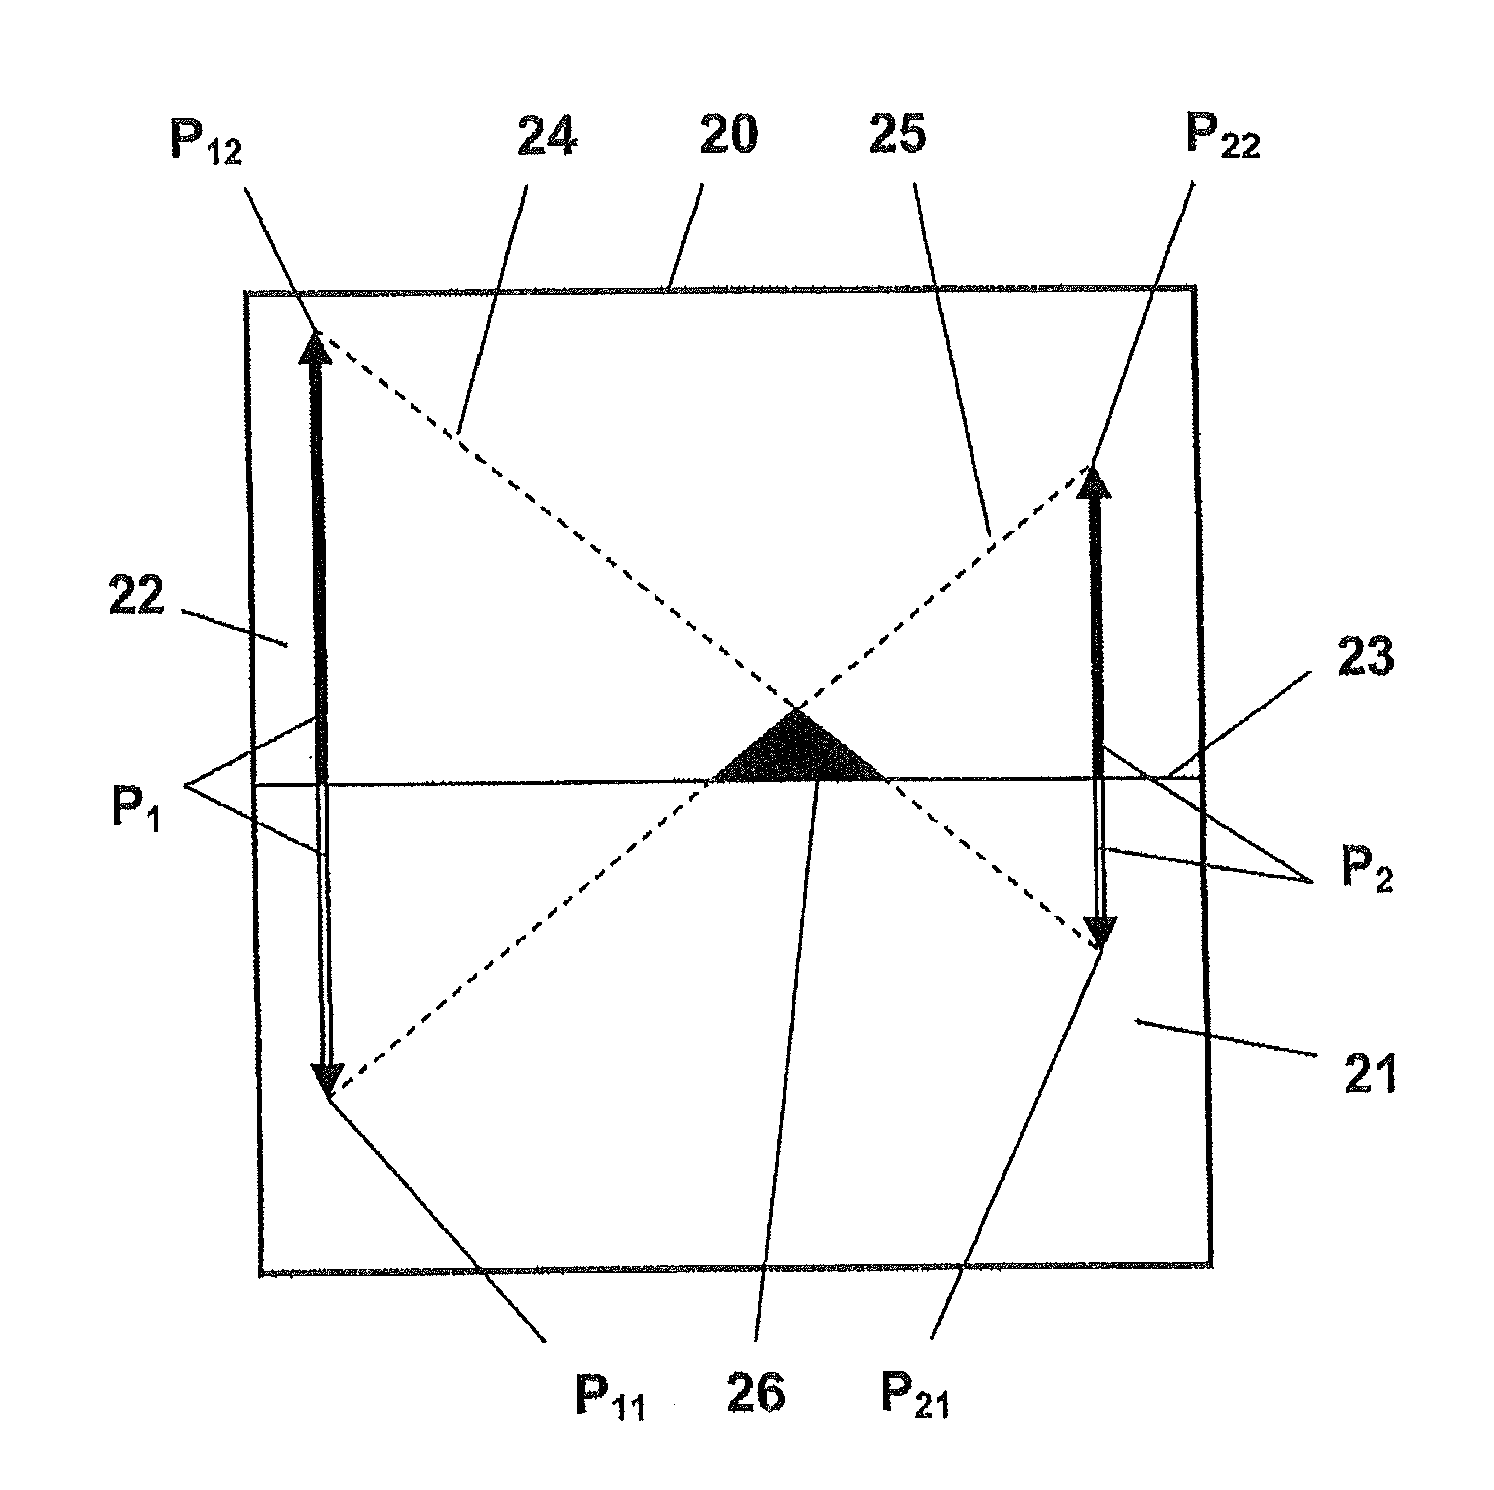
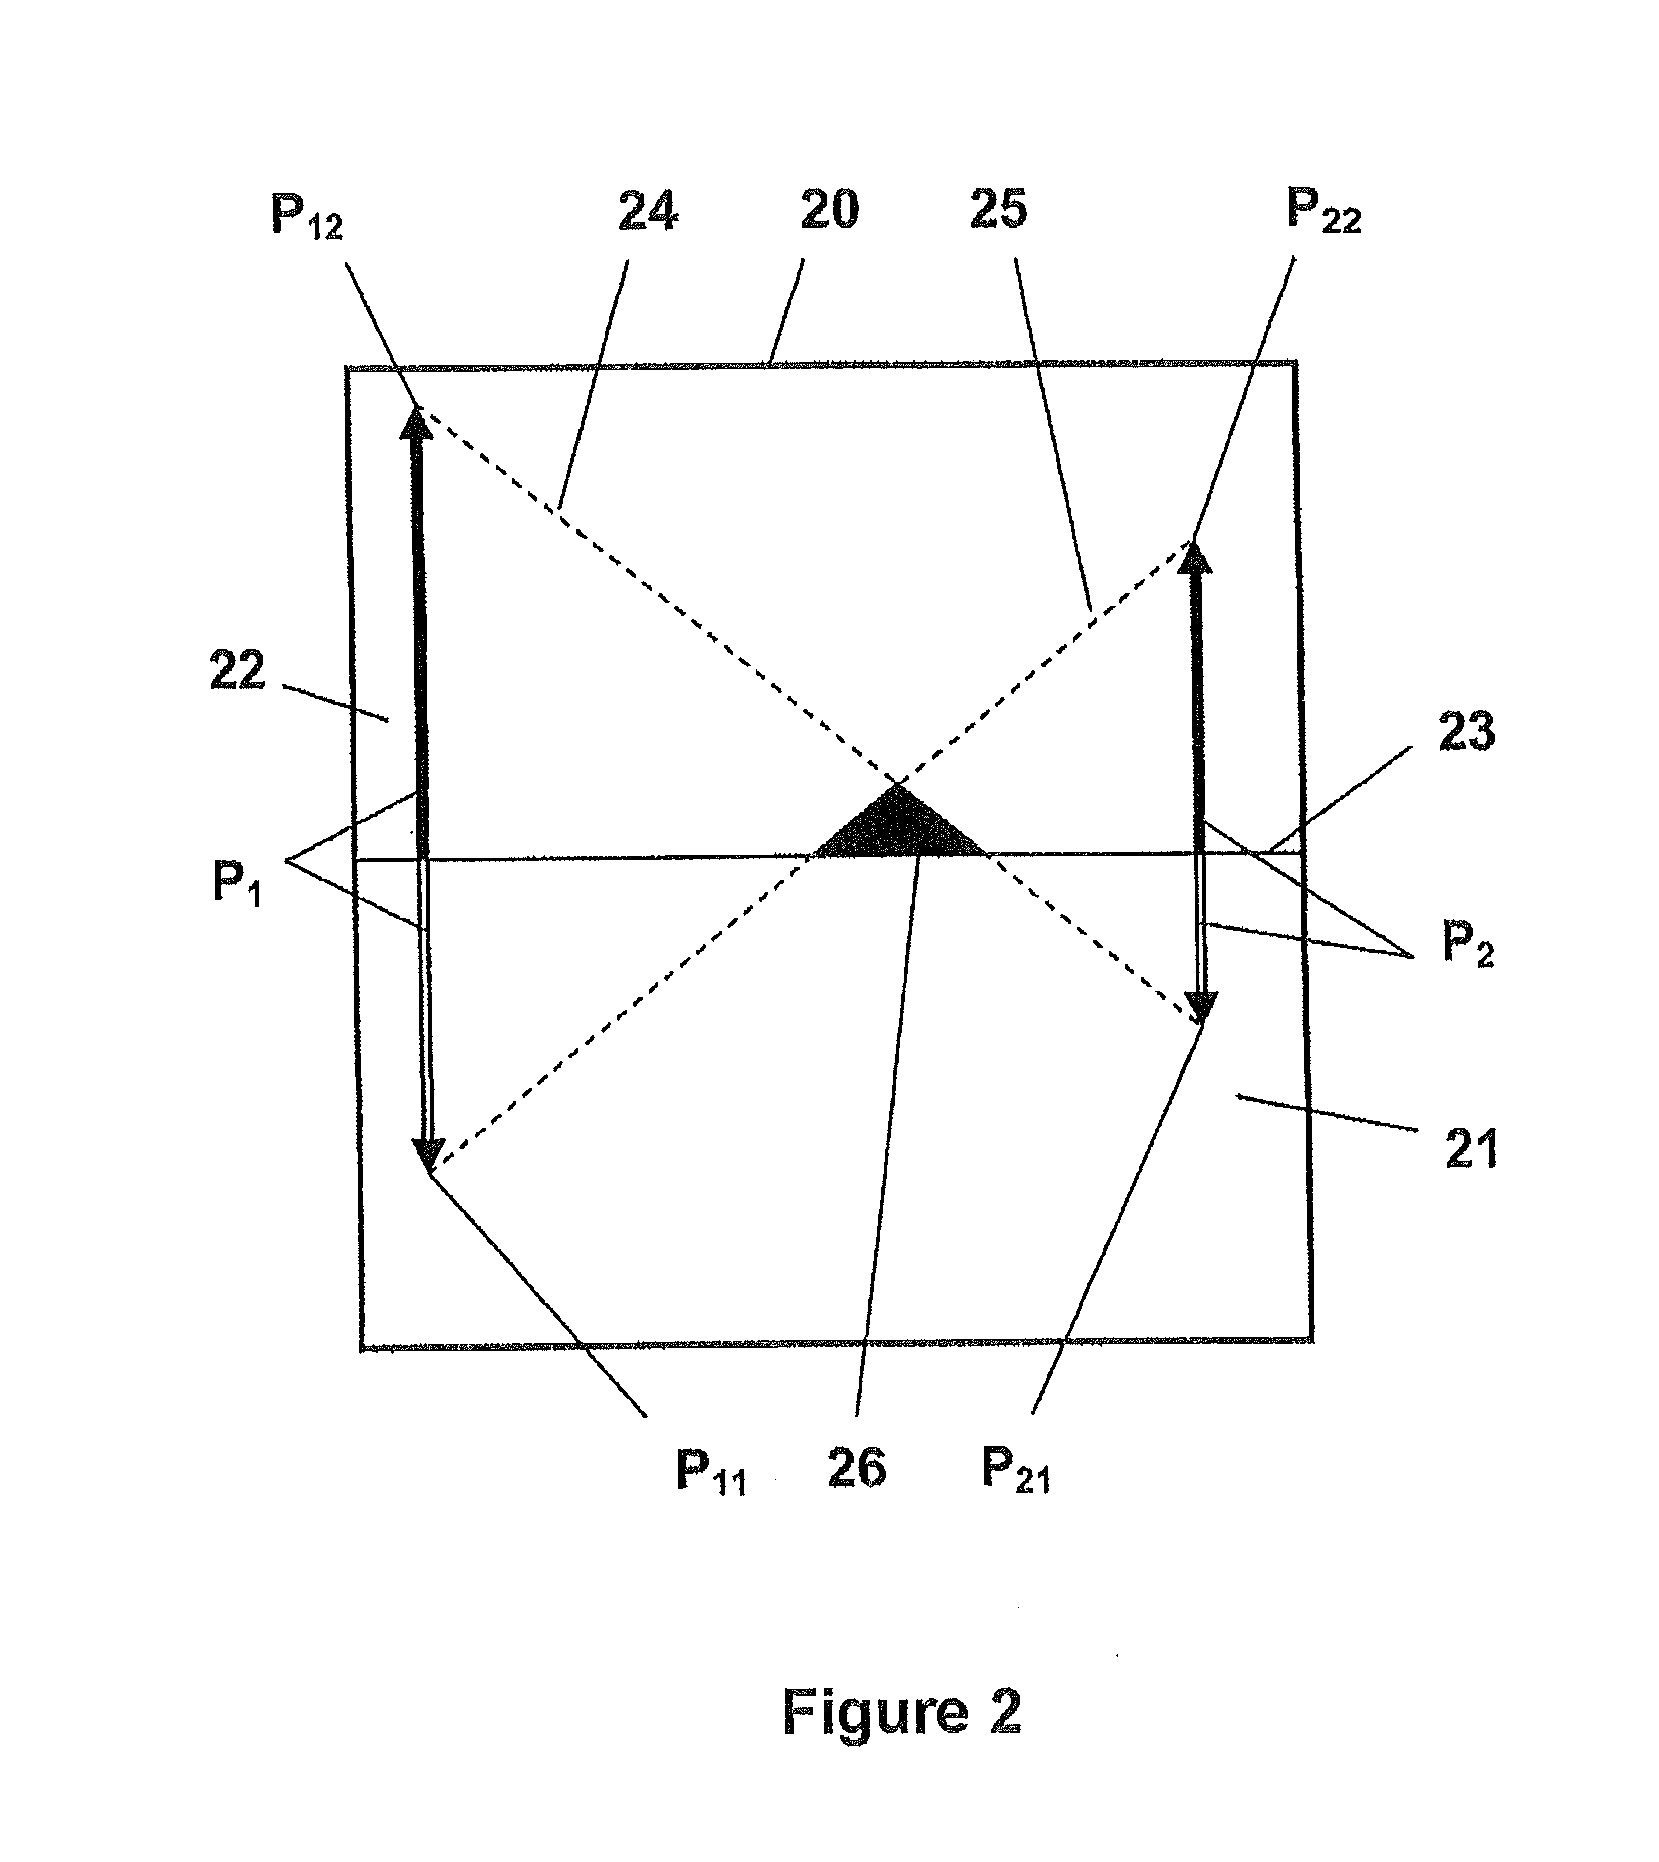
[0011]The disclosure relates to a method for displaying changes in parameter values on a display, which can be executed with a low degree of expenditure on equipment and an apparatus for displaying changes in parameter values on a display.

[0012]On a given display, two successive sampled values of, in each case, two parameter values can be represented as oppositely directed vectors with a common origin on, and orthogonally to, a dividing line, which divides the display into two component areas. More recent sampled values and older (i.e., earlier) sampled values of each of plural parameters can each be plotted together on opposite sides of the dividing line on the same component area. That area which is enclosed by the dividing line and the connecting lines between the respectively older sampled value of a parameter value and the respectively more recent sampled value of the other parameter value can be represented in a highlighted form.

[0013]This resulting area can be triangular for ...


PUM


Abstract

The disclosure relates to a method and apparatus for displaying changes in parameter values on a display surface. Two successive sampled values (P11, P12 and P21, P22) of, in each case, two parameter values (P1, P2) are represented as oppositely directed vectors with a common origin orthogonally with respect to a dividing line which divides the display surface and that area which is enclosed by the dividing line and the connecting lines between the respectively older sampled value (P11 and P21) of a parameter value (P1, P2) and the respectively more recent sampled value (P12 and P22) of the other parameter value (P2, P1) is highlighted.

Description

RELATED APPLICATION[0001]This application claims priority under 35 U.S.C. §119 to German Patent Application No. 102009037578.3 filed in Germany on Aug. 14, 2009, the entire content of which is hereby incorporated by reference in its entirety.FIELD[0002]The disclosure relates to a method and apparatus for displaying changes in parameter values on a display surface.BACKGROUND INFORMATION[0003]The known art includes multimeters with a graphic display such as have been presented with the product designations Fluke 287 and Fluke 289 on the URL http: / / www.elektroniknet.de / home / messentesten / produkte / uebersicht / I / datenlogger / p / d / daten-logger-mit-trendanzeige / on Nov. 12, 2007. Here, a plurality of measured values of one and the same measurement variable are represented as a trend.[0004]It is known that diagnostic predictions for preventive maintenance can be derived from the correlation between time profiles of a suitable selection of parameter values. The derivation of a correlated trend f...

Claims


Application Information

Patent Timeline
IPC IPC(8): G06T11/20
CPCG06T13/80G06T11/206
Inventor ENGELKE, STEFANKLEEGREWE, THOMAS
Owner ABB TECH AG
Why Eureka
Try Eureka