
System and method for analyzing electroencephalography data

a technology of electroencephalography and data analysis, applied in the field of electroencephalography (eeg) data analysis, can solve the problems of inability to summarize eeg data in an acceptable manner, no system that quickly and efficiently determines, etc., and achieve the effect of quick assimilation

Inactive Publication Date: 2011-01-20
MATTHEWS JR THOMAS VIRGIL
View PDF10 Cites 11 Cited by
  • Summary
  • Abstract
  • Description
  • Claims
  • Application Information

AI Technical Summary

Benefits of technology

[0010]In one embodiment, the present invention receives qEEG spectral-analysis results that have been converted to z-scores, converts the z-scores to deviance scores, and computes hit rates, means and other summary measures (median, standard deviation) of appropriate output sets of scores. In one embodiment, the present invention attributes to each of the two sites comprising a pair the z-scores for that pair with respect to the variables of interest. The deviance is obtained by computing the absolute value of each z-score and a mean is calculated for all z-scores associated with a given site. In another embodiment, the sum of absolute values is calculated for all z-scores associated with a given site. In one embodiment, a ranked list is presented on a display, giving the user in a readily understandable format, which can be quickly assimilated, a report with the most deviant sites, site-pairs, and other combinations of sites, based on combining all, or various subsets of, the spectral-analysis z-score findings. This information output is particularly useful because the most common purpose of qEEG and the resulting z-scores is to identify the scalp sites and interrelationships that are most abnormal. Achieving this identification manually with qEEG is a difficult and time-consuming process, and the present invention provides a more accurate solution that can be provided with either static or real-time data.

Problems solved by technology

There is currently no system that quickly and efficiently determines the most abnormal brain region from EEG.
Previous systems are unable to summarize EEG data in an acceptable manner for this purpose as certain EEG input-sets are thought to be unsuitable for combination.

Method used


Image

  • System and method for analyzing electroencephalography data
  • System and method for analyzing electroencephalography data
  • System and method for analyzing electroencephalography data

Examples


Embodiment Construction

nt software. In one embodiment, the single scores are used to measure the effects of medication. In another embodiment, the single scores are used to measure treatment response.

[0014]These and other features of the present invention are described in greater detail below in the section titled DETAILED DESCRIPTION OF THE INVENTION.

BRIEF DESCRIPTION OF THE DRAWING FIGURES

[0015]The present invention is described herein with reference to the following drawing figures, with greater emphasis being placed on clarity rather than scale:

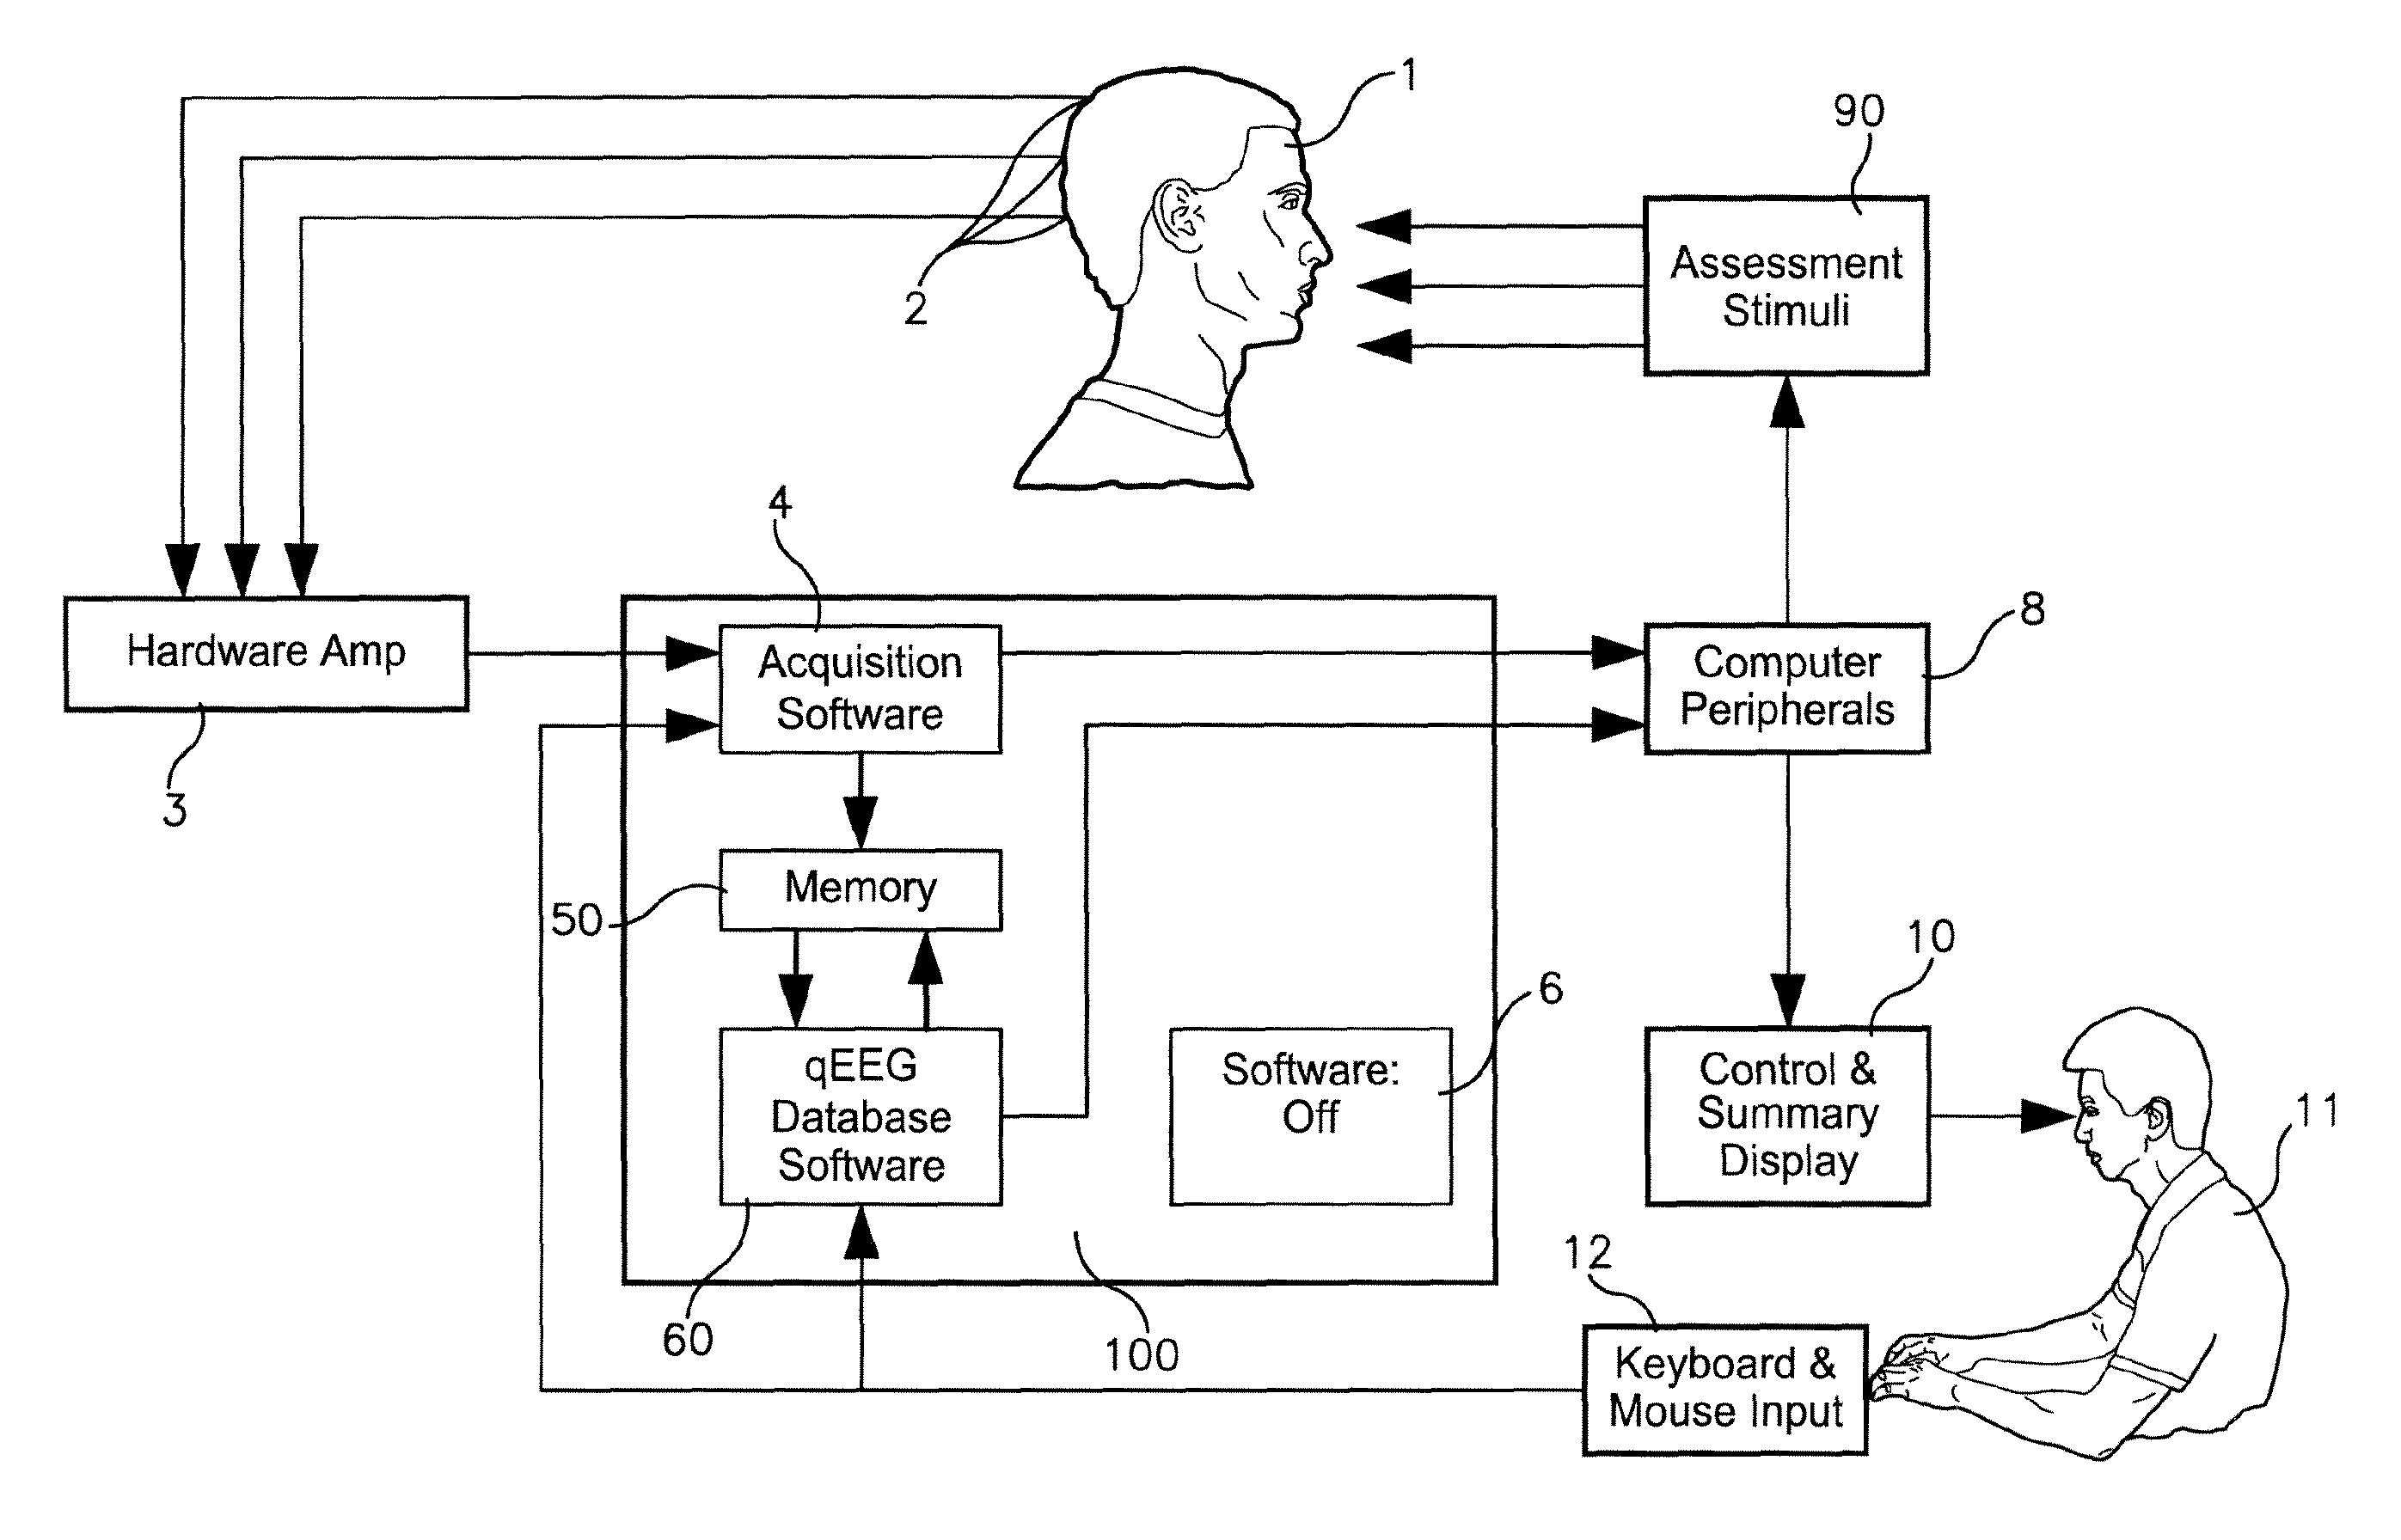
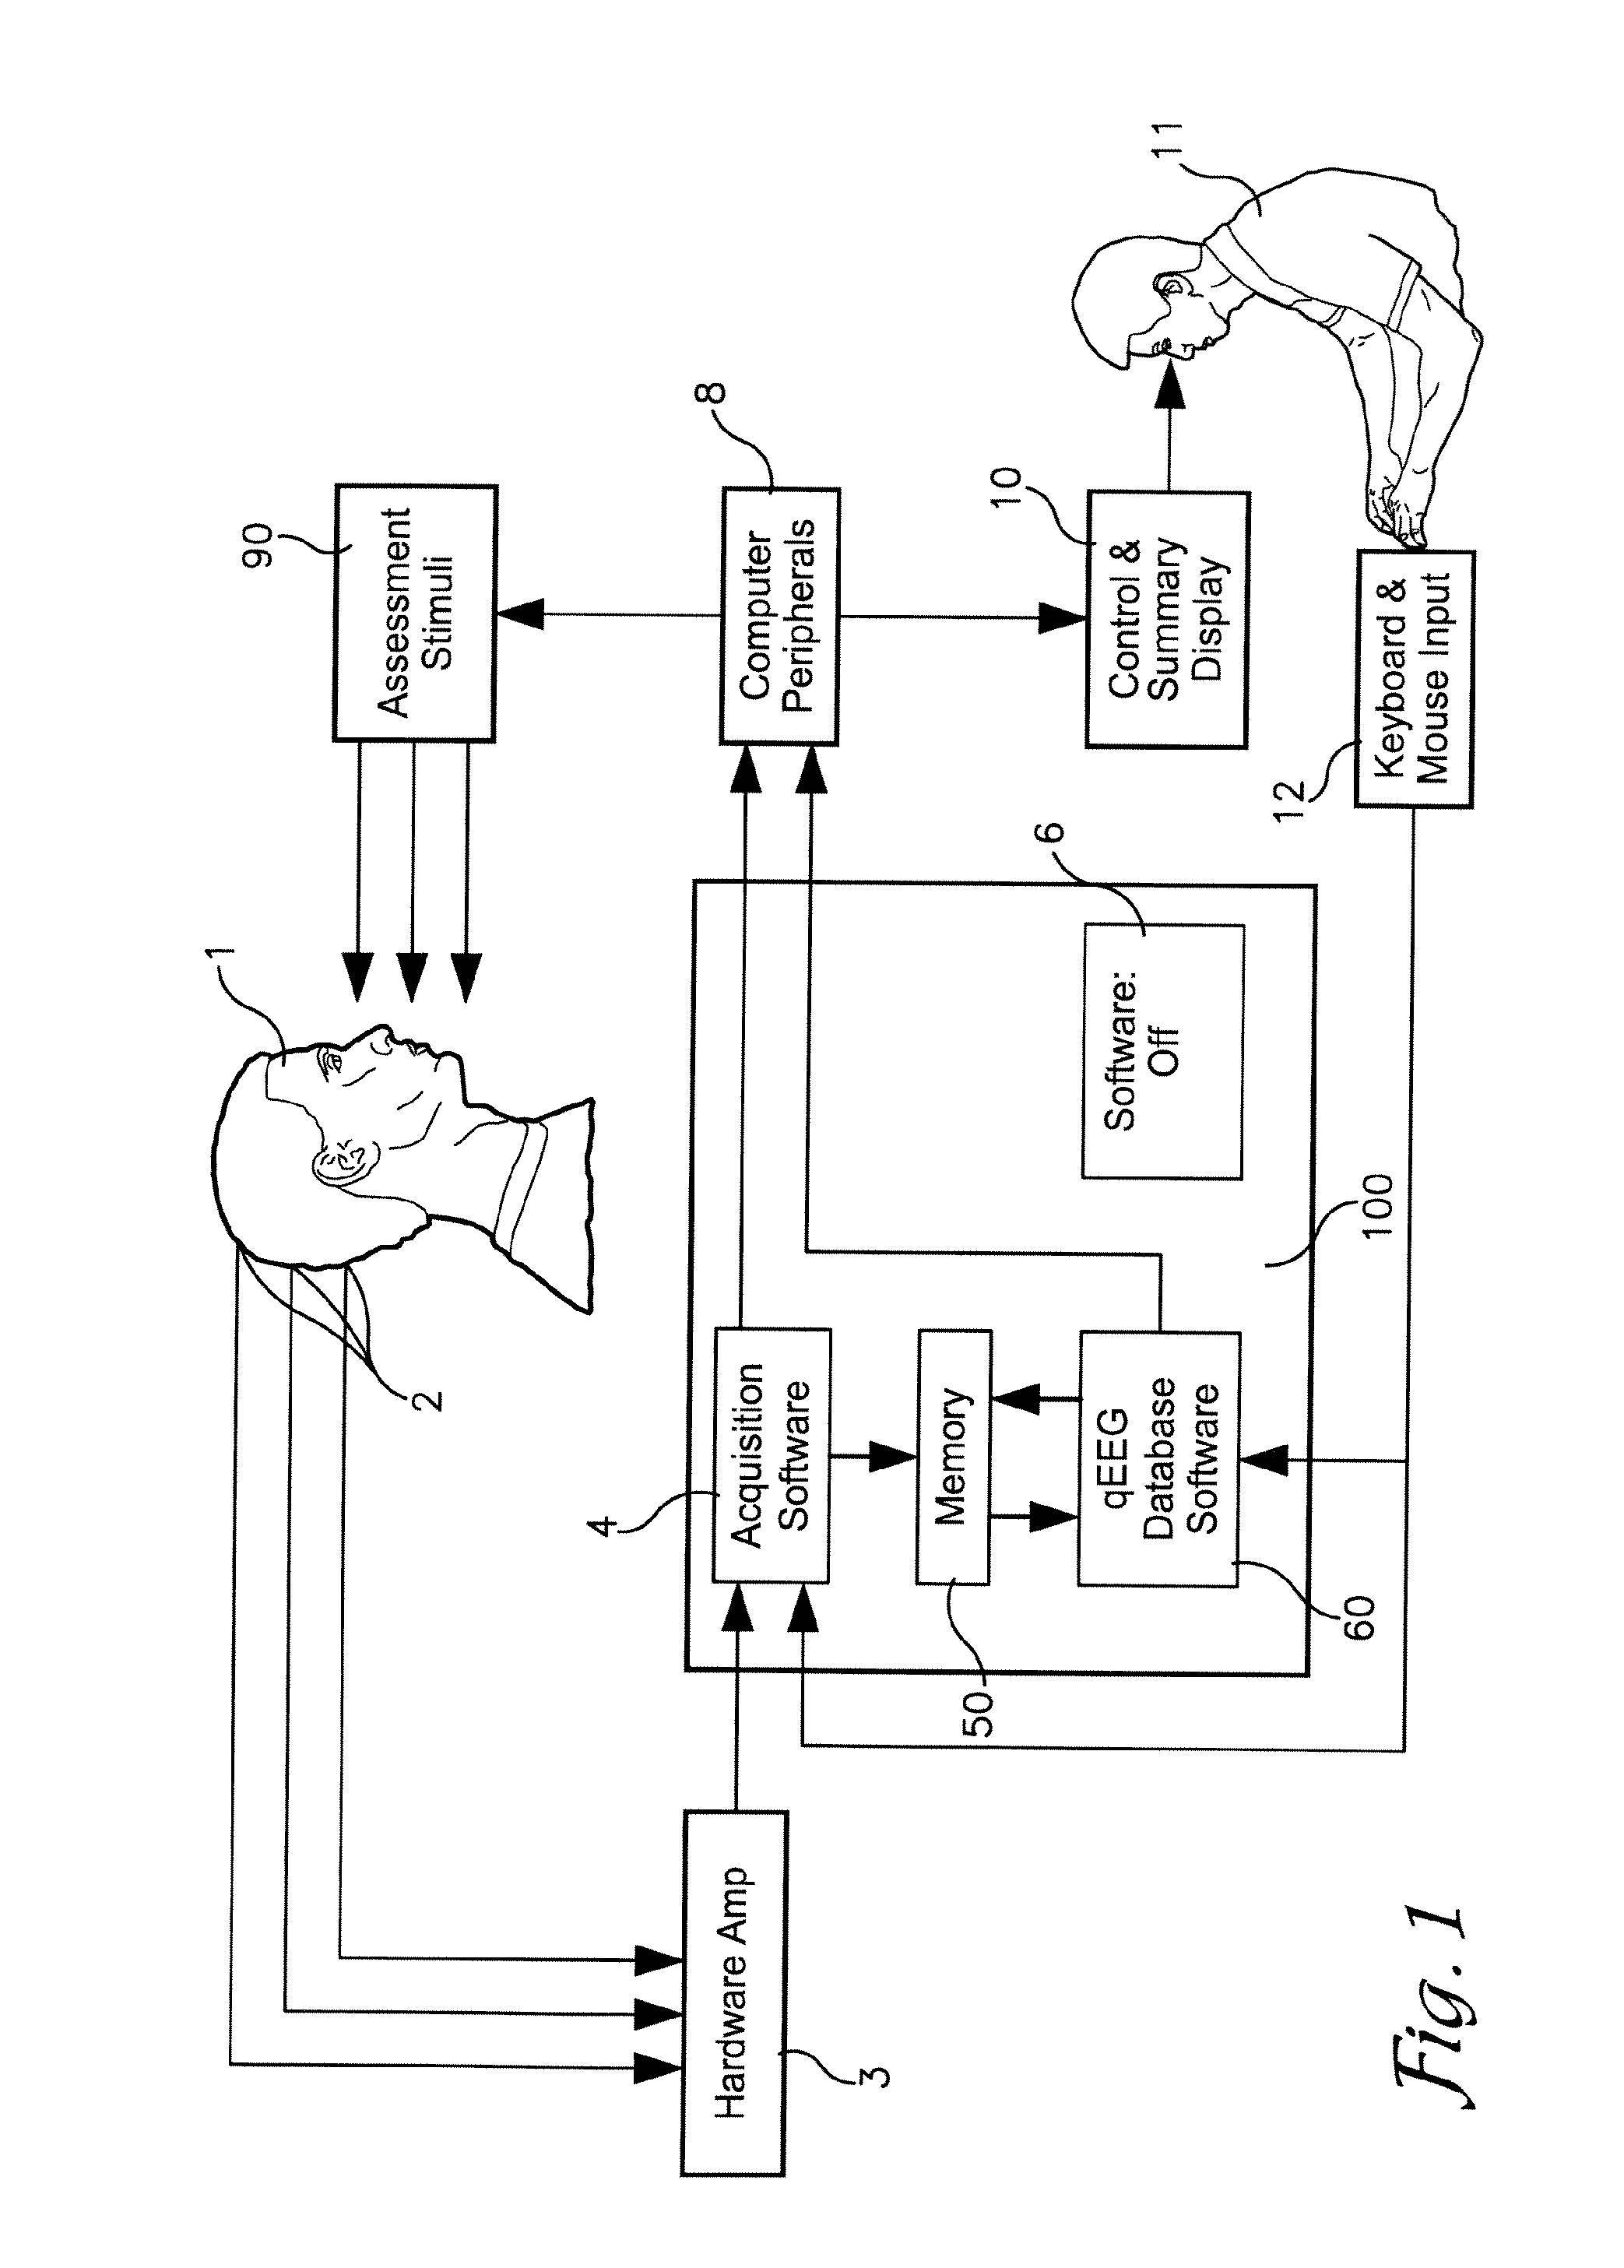
[0016]FIG. 1 is a diagram representing the data flow of EEG gathering and analysis that occurs before using the Planner embodiment of the present invention;

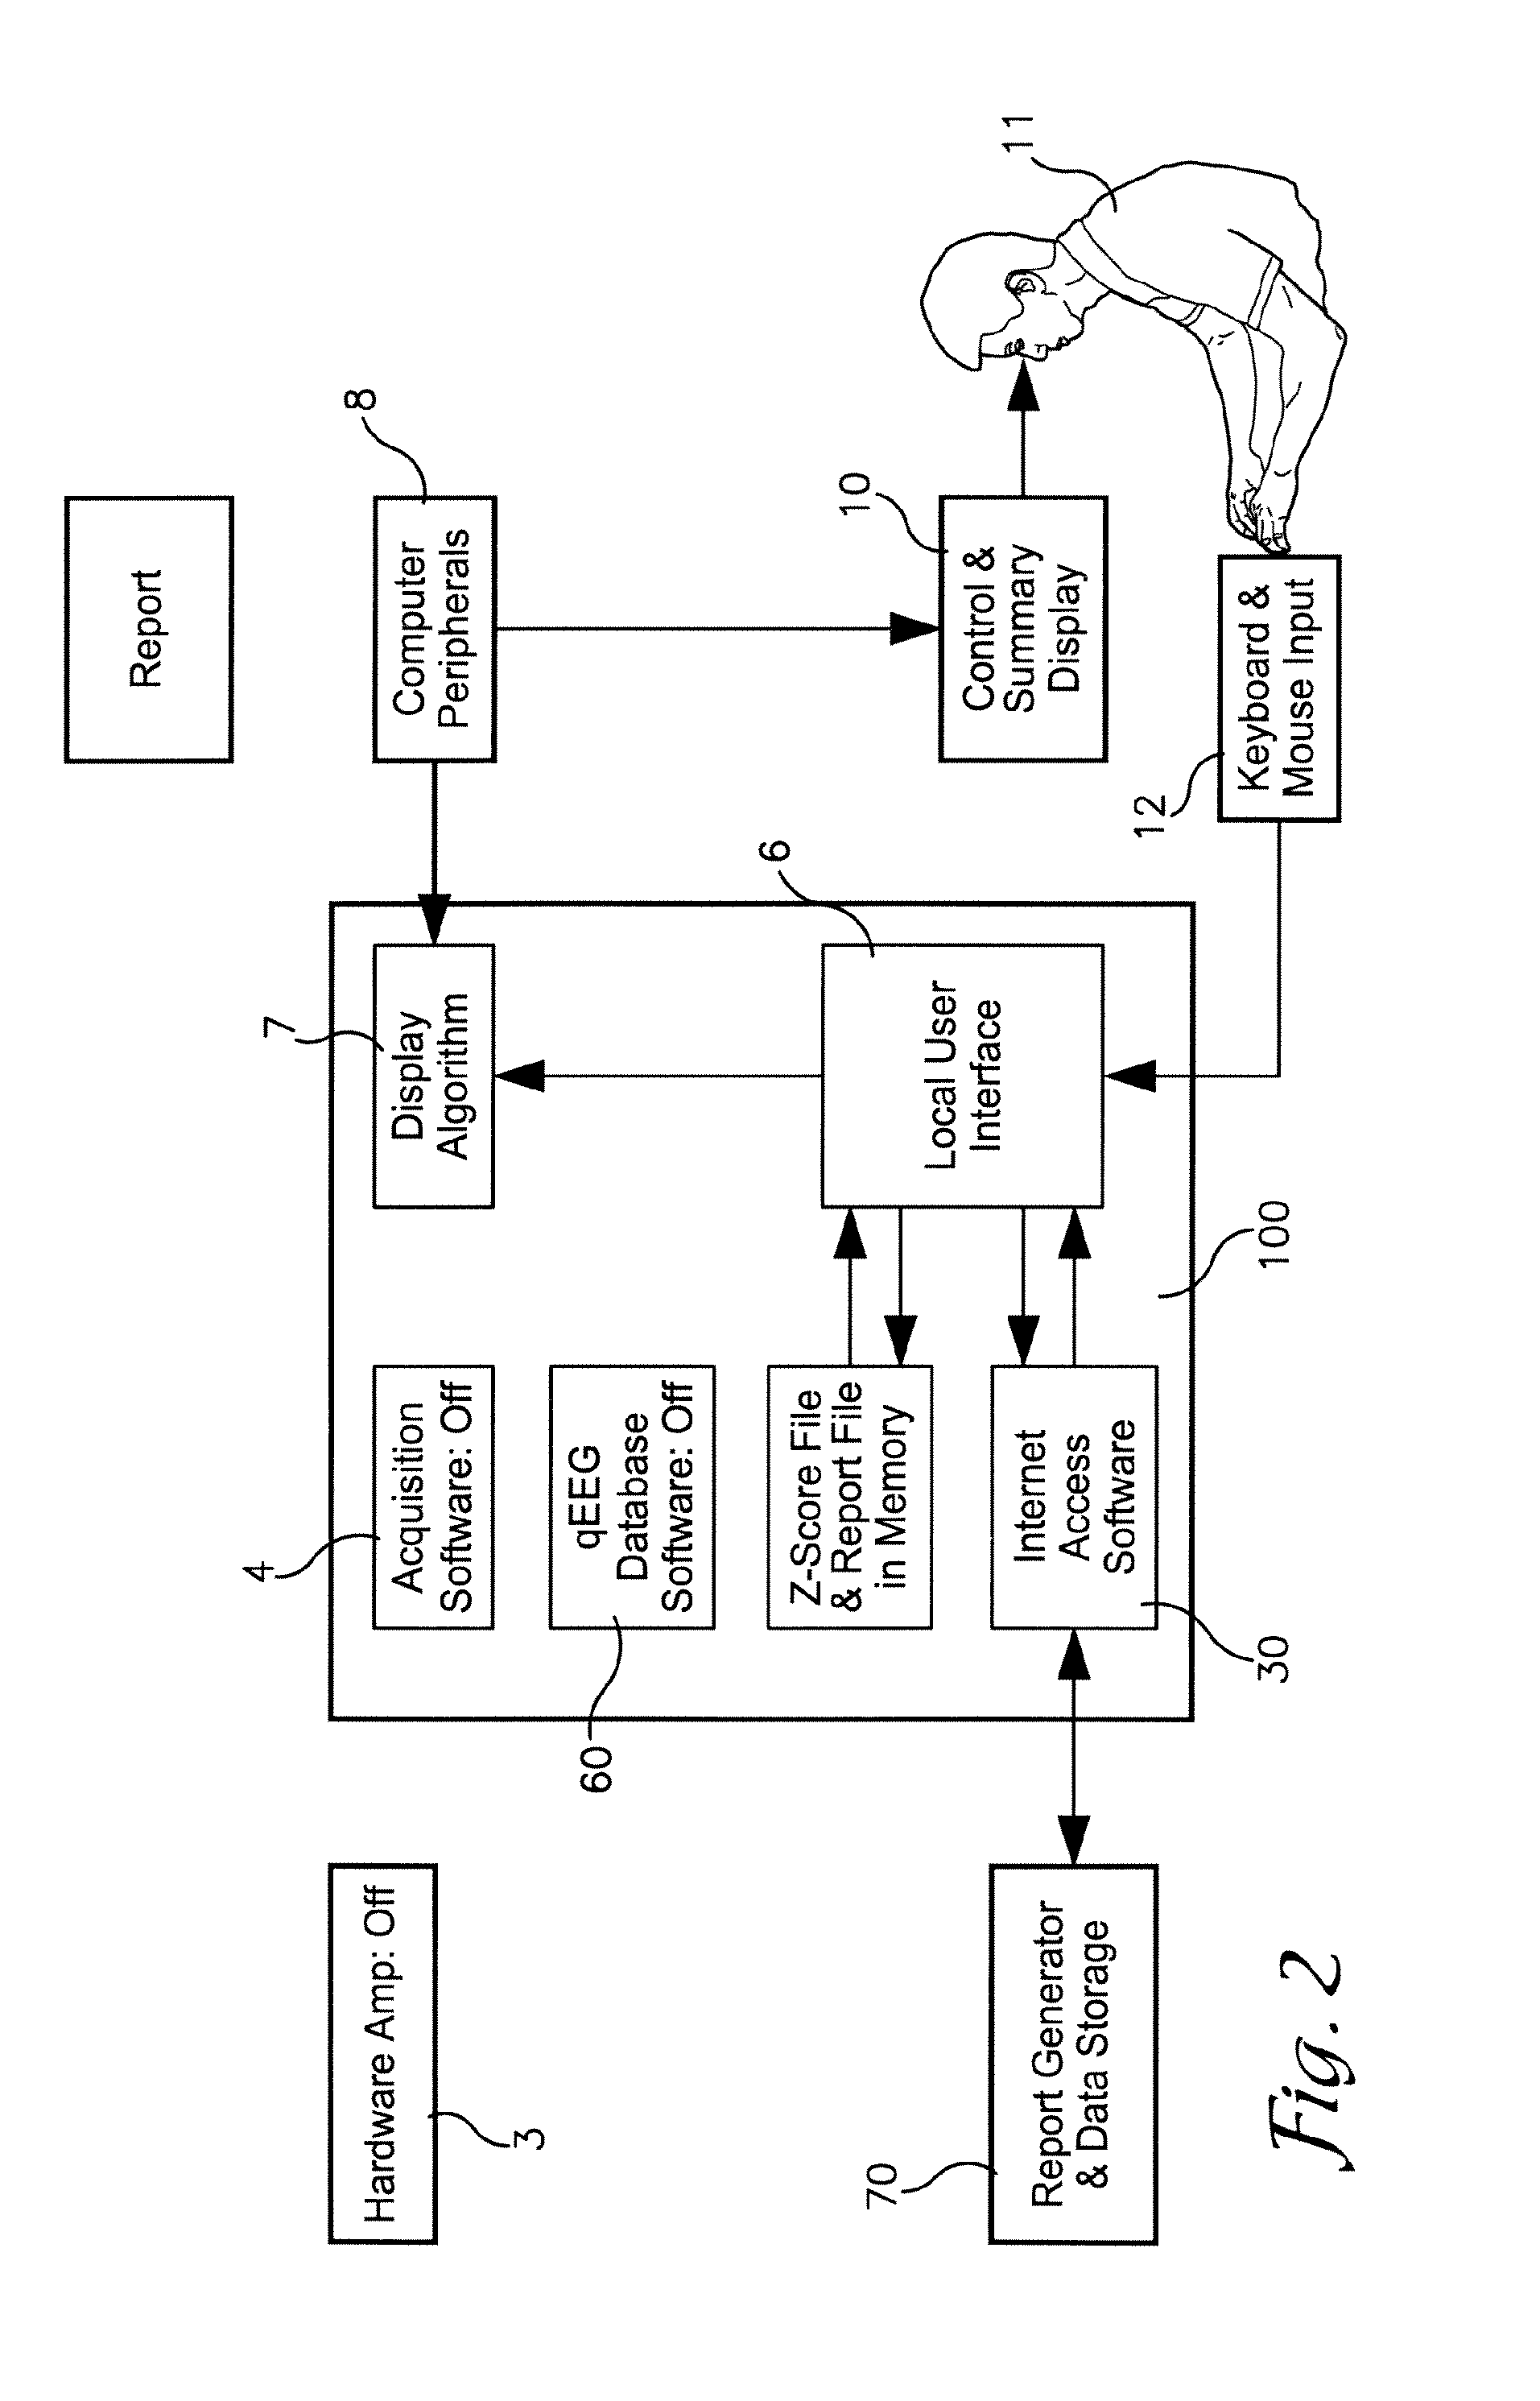
[0017]FIG. 2 is a diagram representing the data flow of the Planner embodiment of the present invention;

[0018]FIG. 3 is a diagram representing the data flow of the feedback loop and control in neurofeedback;

[0019]FIG. 4 is a diagram representing the data flow of the Monitor embodiment of the present inventio...


PUM


Abstract

A system and method for analyzing EEG data. The system comprises data from at least one or all of the 19 (or more) standard scalp locations, a computing device 100 operable to calculate deviance for the data, and a single score for each of a plurality of scalp sites based on the deviance. An output device 10 presents a ranked list of the single scores to identify sites showing abnormal EEG, or a single score for all sites and pairs combined that may be used in assessment or operant conditioning.

Description

FIELD OF THE INVENTION[0001]The present invention relates to analyzing electroencephalography (EEG) data. More particularly, the invention relates to computer programs that receive EEG data, perform a series of transformations with the EEG data, produce a single score for each of one to nineteen or more scalp sites, produce a single score for each of the scalp site-pairs, produce a single combined score for all the measured sites and site-pairs, and present the data in a readily understandable format, which can be quickly assimilated.BACKGROUND OF THE INVENTION[0002]EEG refers to the recording of the brain's spontaneous electrical activity, generally from multiple electrodes placed on the scalp. In the clinical neurology setting, a health professional with specific training in the interpretation of EEGs reads the EEG results by visually inspecting the waveforms, searching for momentary transient activity that indicates abnormality. Computer signal processing of the EEG, or quantitat...

Claims


Application Information

Patent Timeline
IPC IPC(8): A61B5/0476
CPCA61B5/0482A61B5/0476A61B5/375A61B5/369A61B5/372A61B5/386
Inventor MATTHEWS, JR., THOMAS VIRGIL
Owner MATTHEWS JR THOMAS VIRGIL
Learn More