Eureka AIR delivers breakthrough ideas for toughest innovation challenges, trusted by R&D personnel around the world.

Apparatus and Method for Measuring Service Performance

a service performance and applicability technology, applied in the field of methods and systems for measuring service performance, can solve the problems of low re-use of “snapshot” surveys, lack of sophistication in the administration and analysis of satisfaction and loyalty measurement instruments, and relatively high cost of creation and administration

Inactive Publication Date: 2008-08-28
WHYDATA
View PDF10 Cites 30 Cited by
  • Summary
  • Abstract
  • Description
  • Claims
  • Application Information

AI Technical Summary

Benefits of technology

[0028]Stakeholder Influence Map: a visual representation of relationships and their effect on contractual outcomes, containing relationship paths, influence strengths, likely actions, and outcome effects.

Problems solved by technology

Although significant basic science and practice has been created, administration and analysis of satisfaction and loyalty measurement instruments is lacking sophistication.
These “snapshot” surveys are created or customized “from scratch” and are often relatively expensive to create and administer.
“Snapshot” surveys also have a low level of re-use, as their level of customization makes them inflexible as time passes, market or customer conditions change, or business priorities shift.
Because companies invest so much in a “snapshot” survey, they are often long, and require an investment of time and attention by the survey respondent.
These factors make it difficult to use the “snapshot” survey repeatedly for historical trending or continuous improvement purposes.
These surveys are often only usable as a “temperature check”, but lack detailed analysis, and reliability of the data for in-depth analytical determination of customer satisfaction, key drivers, and customer loyalty.
Thus, both approaches lack significant and meaningful linkage to the financial and operational data that is traditionally used by businesses for performance management of business processes and organizations.
As a result, customer satisfaction and loyalty data has been “silo-ed” from financial and operational data, and is rarely analyzed in concert to determine the cause-and-effect relationships that can be determined by bringing the data together within an analytical framework.

Method used


Image

  • Apparatus and Method for Measuring Service Performance
  • Apparatus and Method for Measuring Service Performance
  • Apparatus and Method for Measuring Service Performance

Examples


Embodiment Construction

[0047]The present invention overcomes many of the prior art problems associated with measuring and evaluating service performance. The advantages, and other features of the system disclosed herein, will become more readily apparent to those having ordinary skill in the art from the following detailed description of certain preferred embodiments taken in conjunction with the drawings which set forth representative embodiments of the present invention and wherein like reference numerals identify similar structural elements.

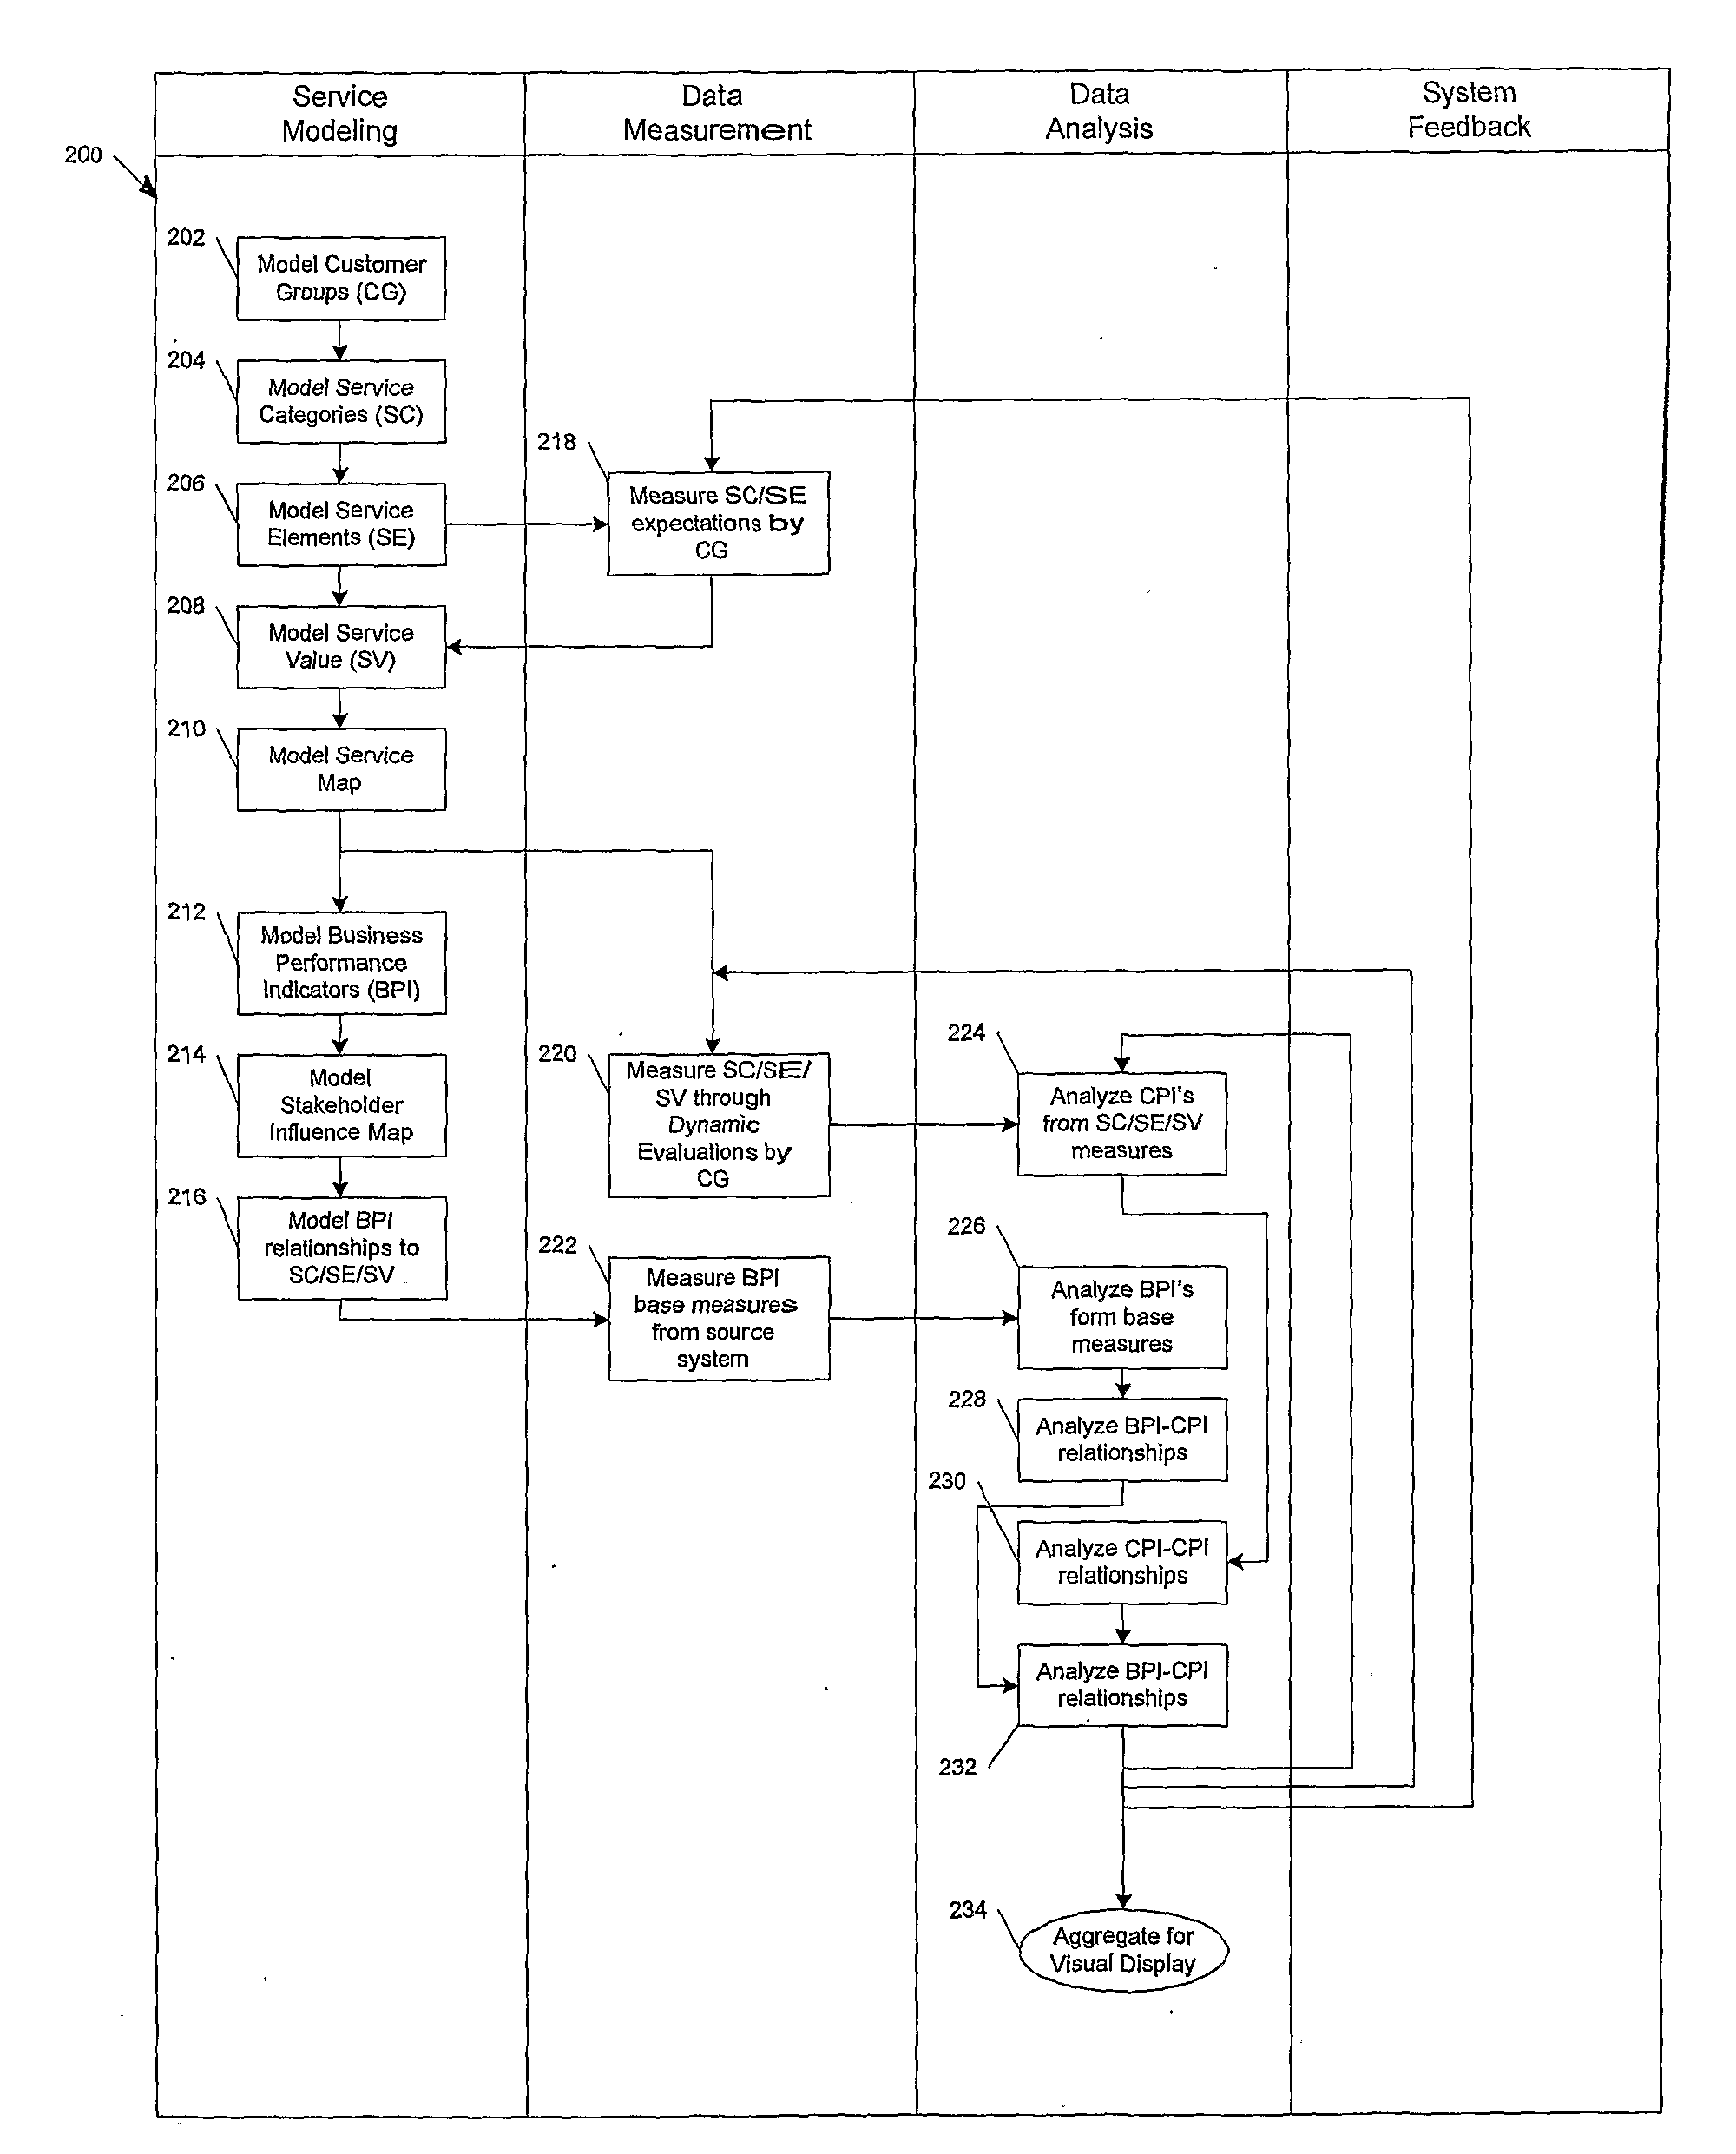
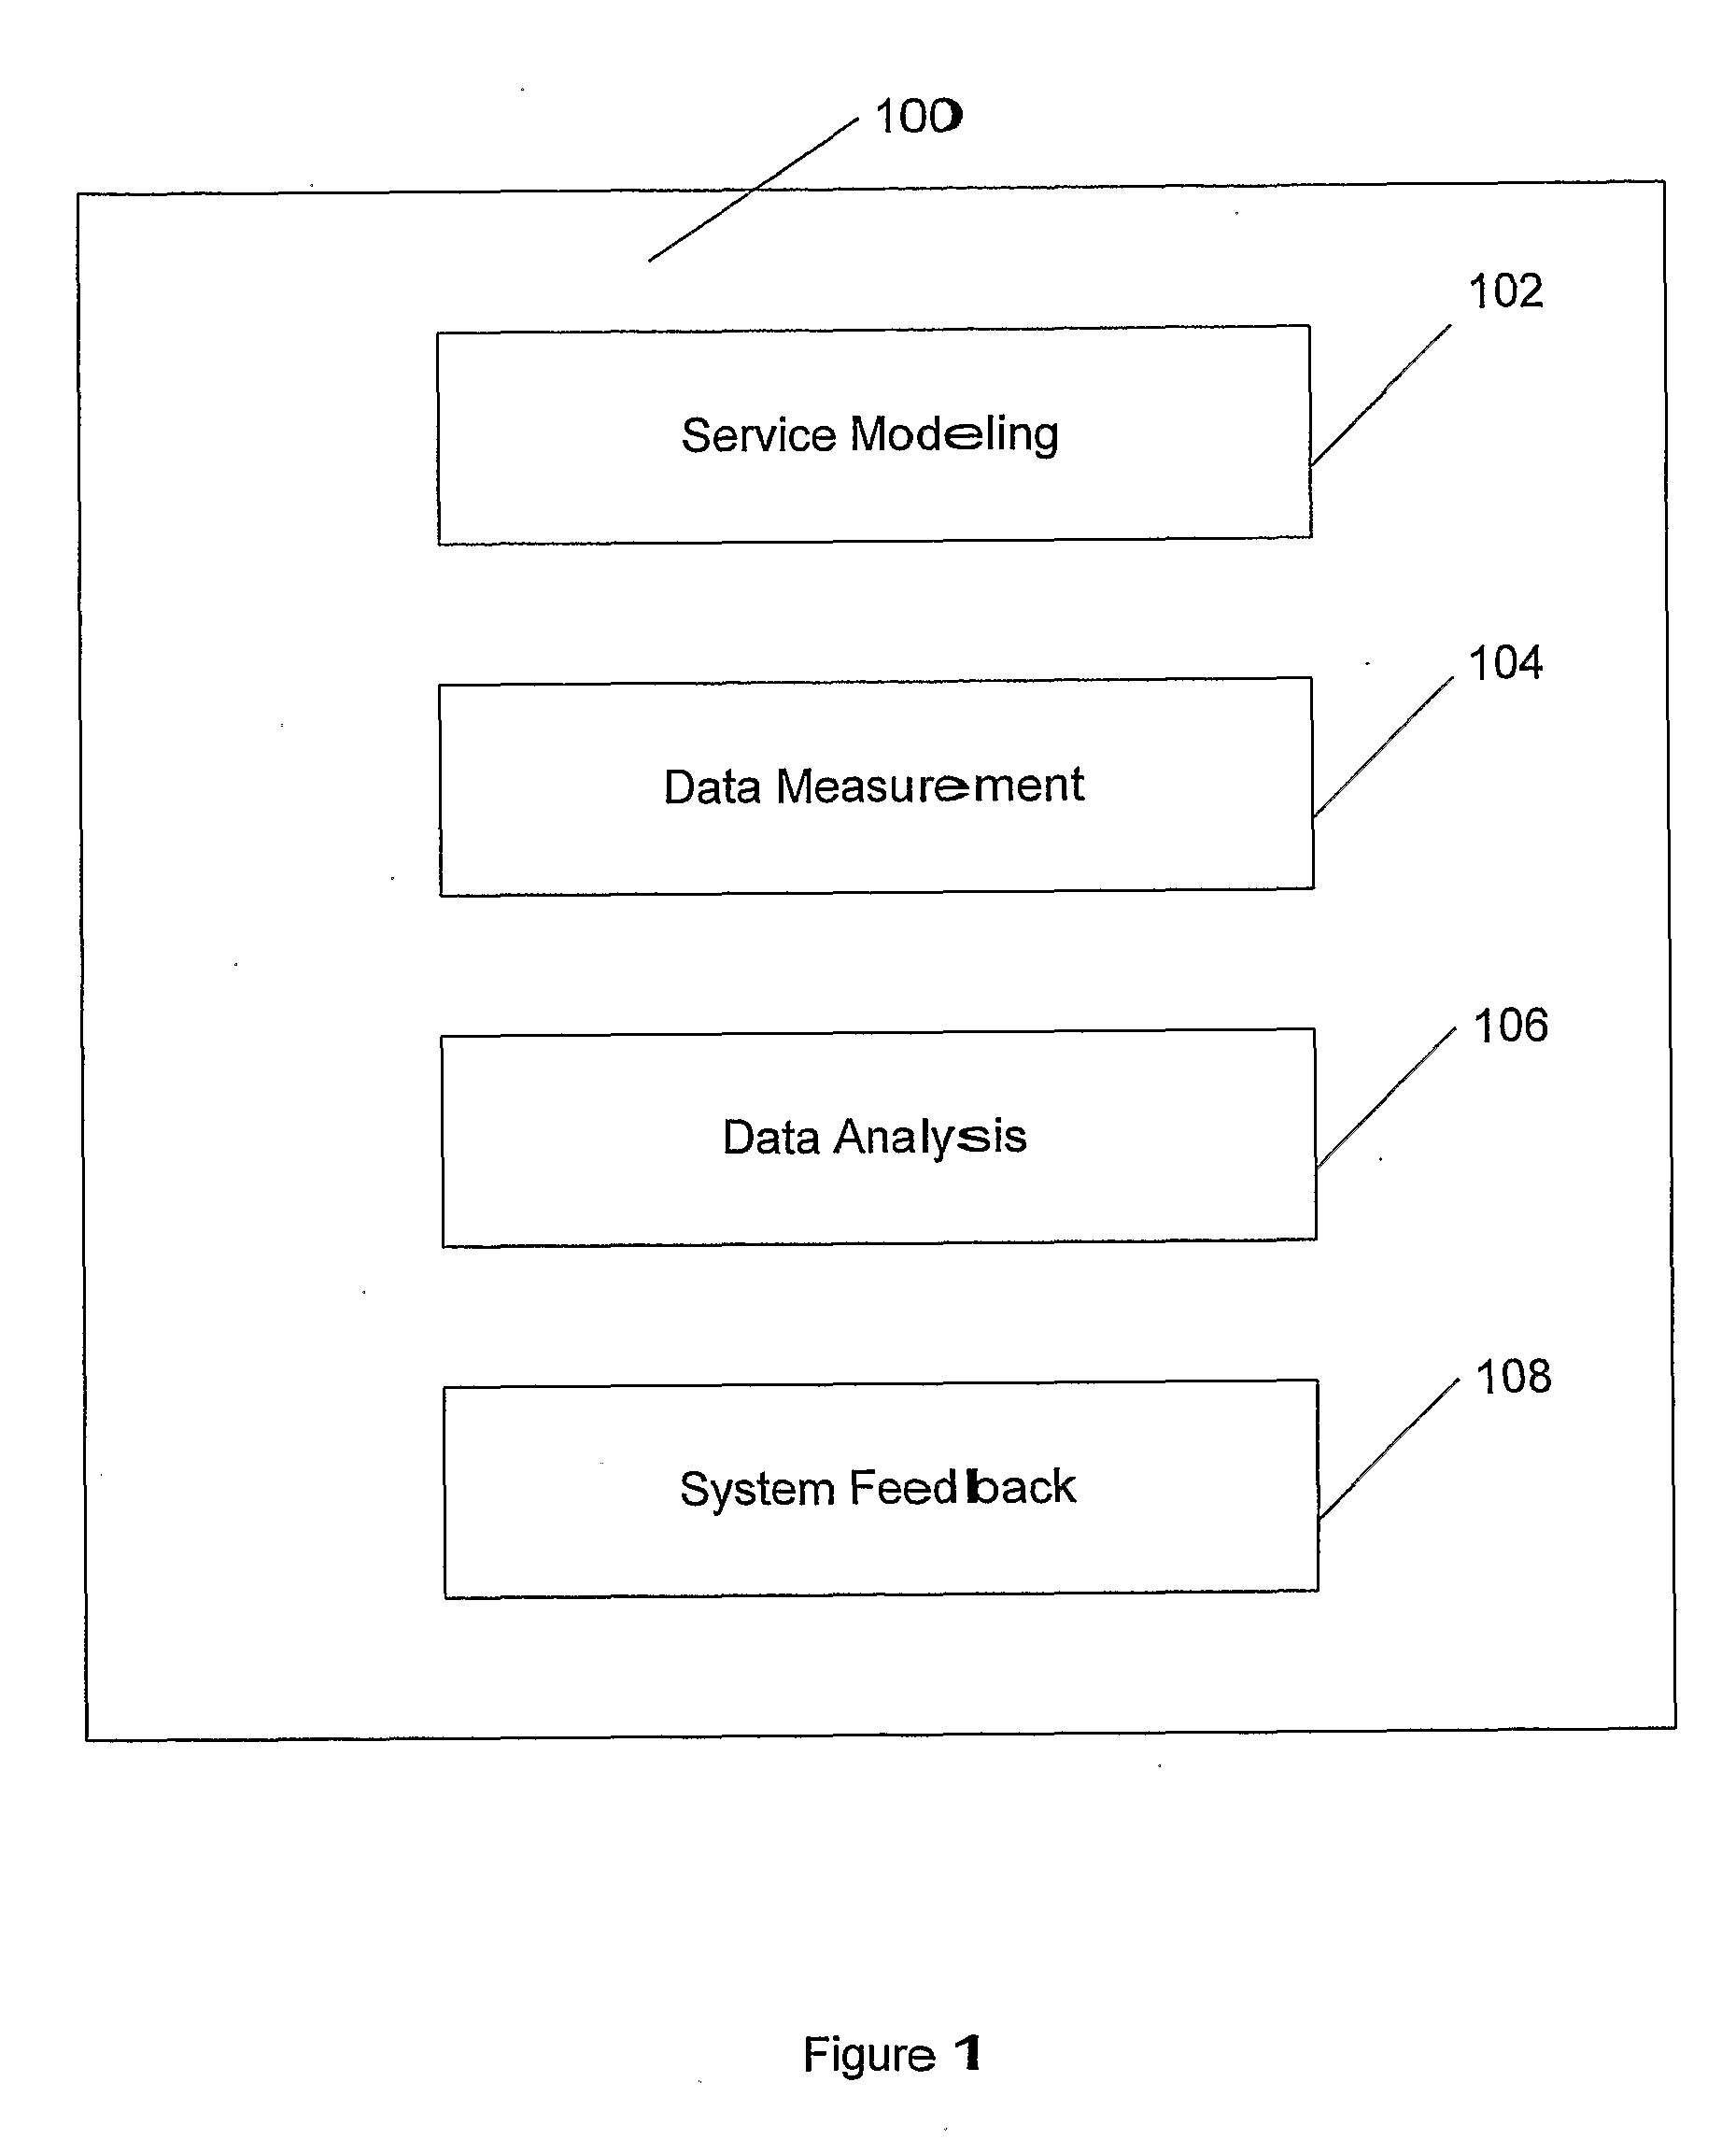
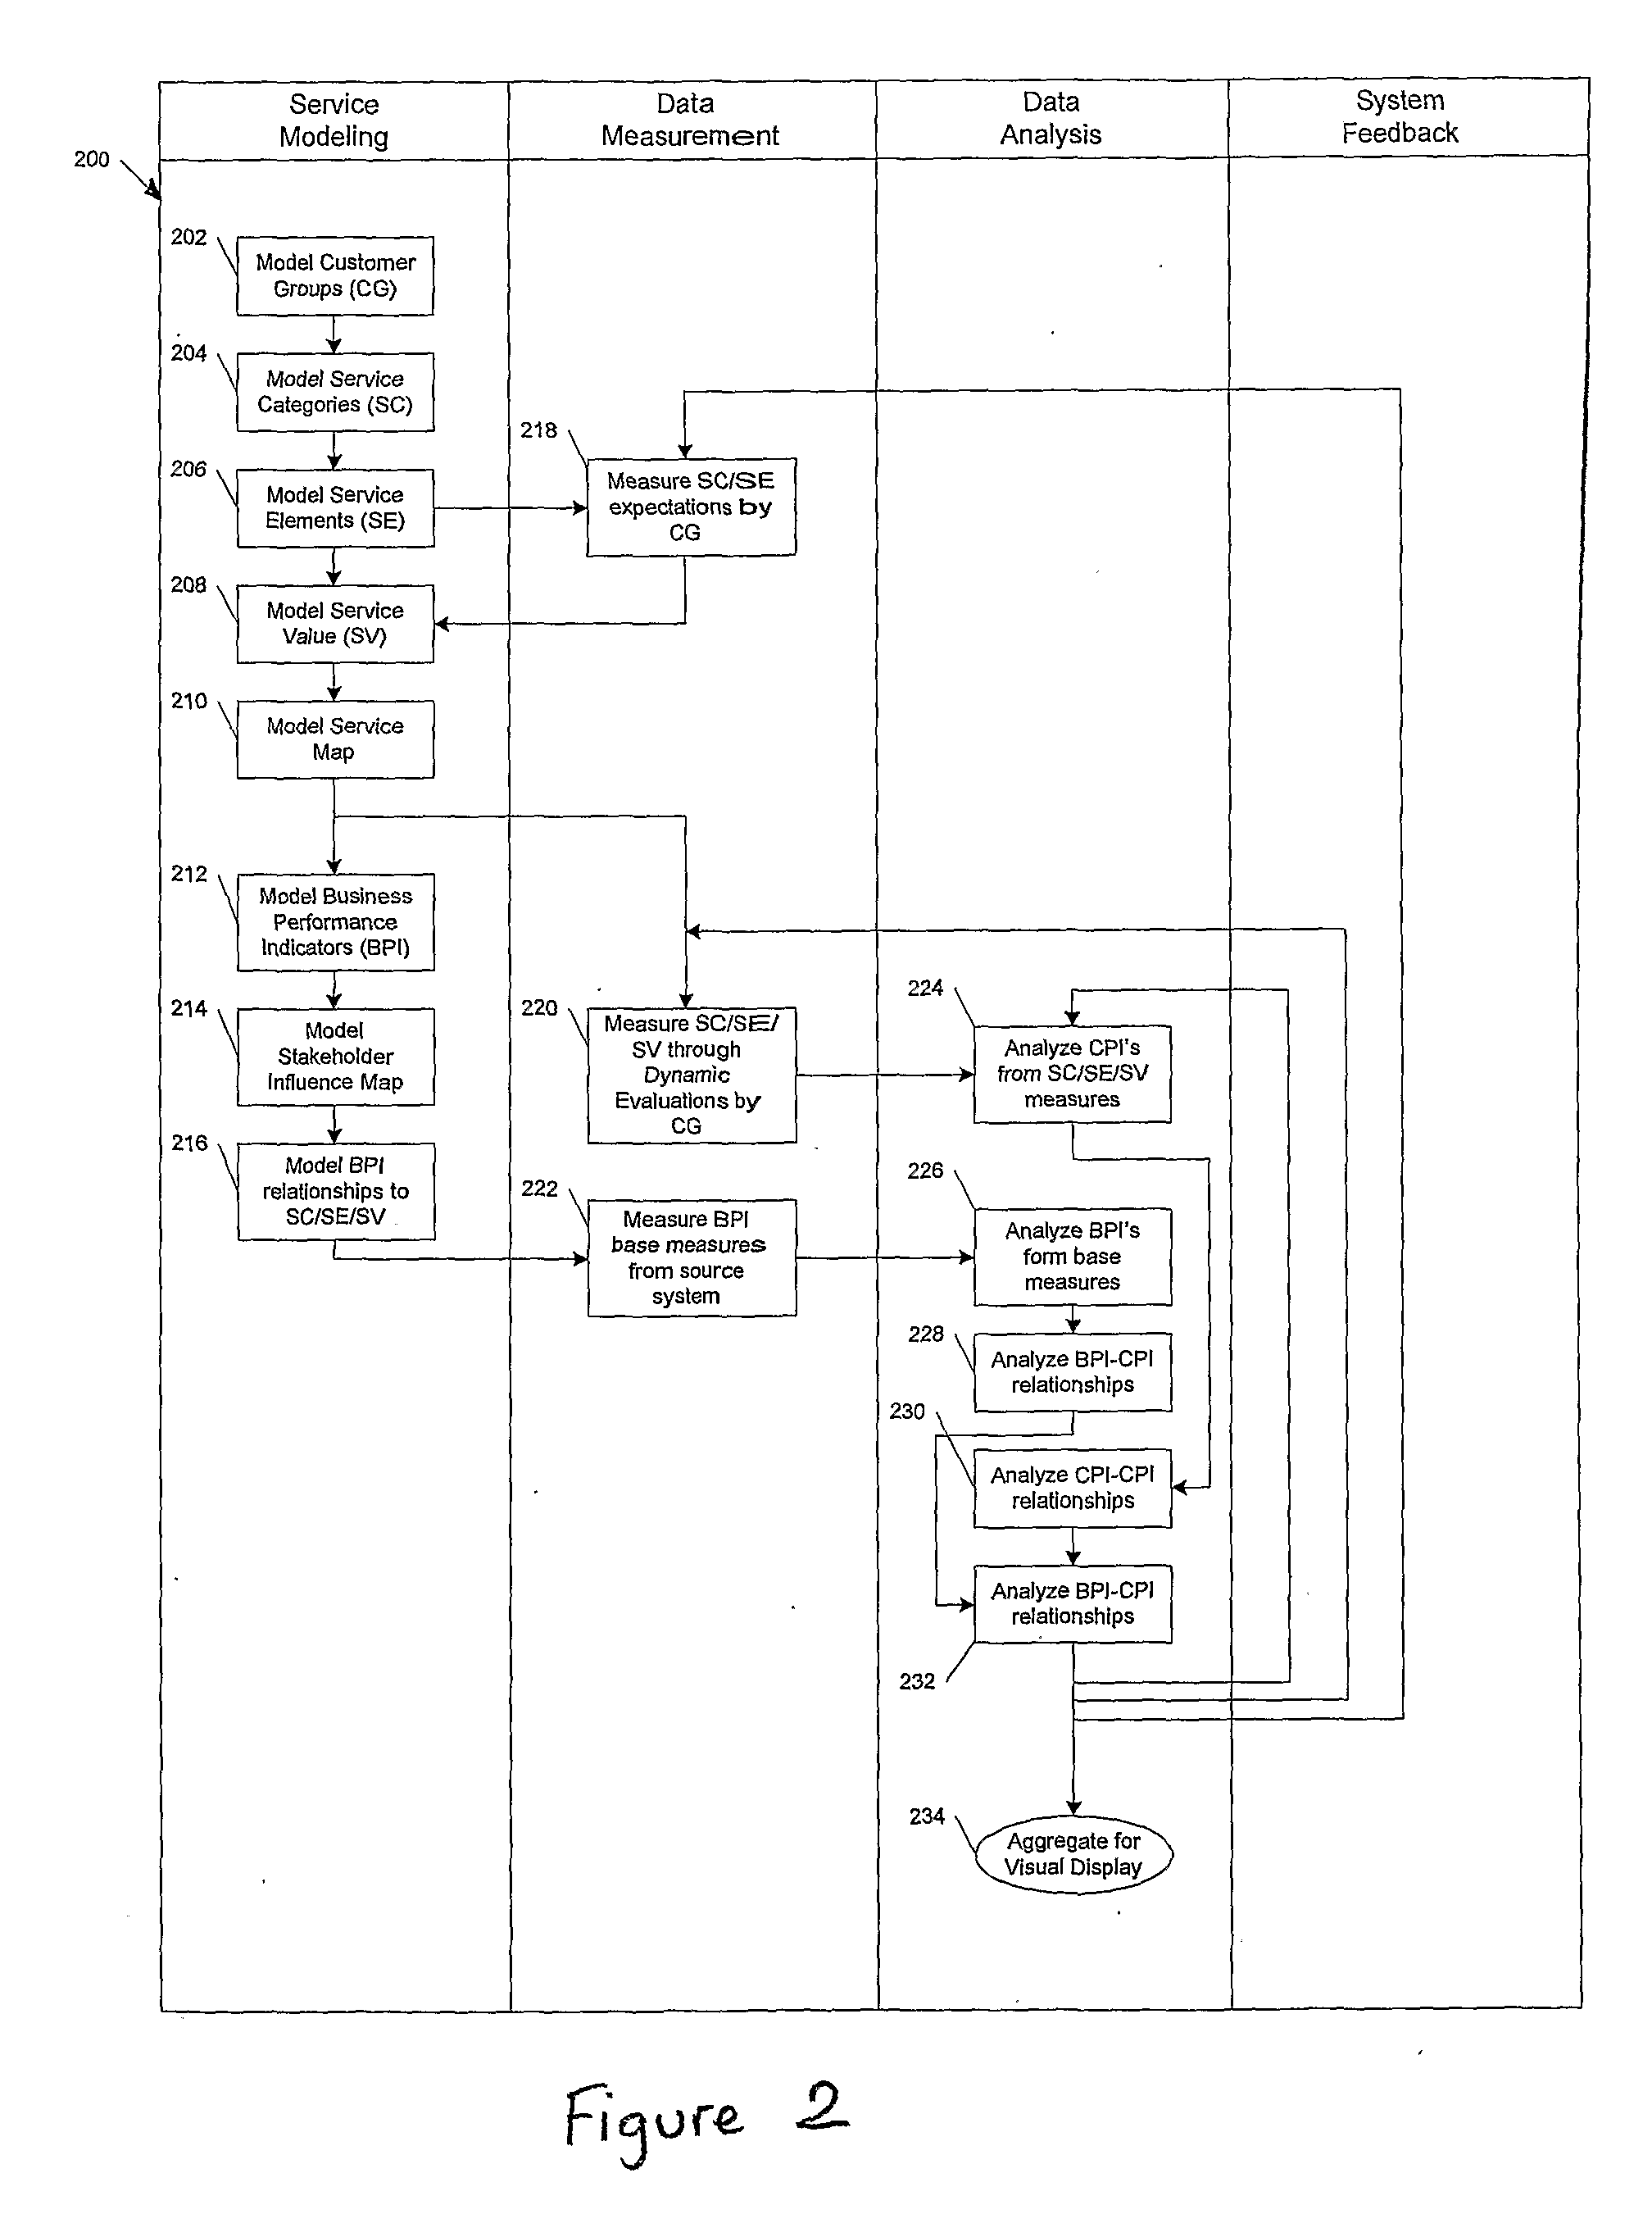
[0048]In brief overview, the disclosed technology relates to measuring a perceived satisfaction and perceived value (e.g., perception measures) of customers and other stakeholders in a scientifically rigorous and repeatable manner over time. For example, the Service Measurement Framework (SMF), disclosed herein, is useful for the measurement of perception in contractual customer relationships where service is a dominant component of the scope of the contract, in ter...


PUM


Abstract

A method for measuring satisfaction within a service environment including the steps of modeling contractual customer service relationships using a hierarchical composition model with discrete abstract elements, creating and distributing customer perception surveys having questions, wherein the questions are dynamically generated from a computer database based on events within the service environment and element weightings within a hierarchical composition model, collecting and analyzing the customer perception surveys, calculating aggregate measures of customer perception that have statistical reliability, correlating the measures of customer perception to create at least one statistical causality between customer perception and business performance and adjusting the element weights using calculated customer perception measures and statistical correlation measures to refine reliability of future analysis and calculation results.

Description

CROSS-REFERENCE TO RELATED APPLICATION[0001]This application claims priority to U.S. Provisional Patent Application No. 60 / 621,713, filed Oct. 25, 2004 and U.S. Provisional Patent Application No. 60 / 684,814 filed May 25, 2005, each of which is incorporated herein by reference.BACKGROUND OF THE INVENTION[0002]1. Field of the Invention[0003]The subject disclosure relates to methods and systems for measuring service performance, and more particularly to improved methods and systems for using measures of service performance to enhance service.[0004]2. Background of the Related Art[0005]Companies have been using survey science and market research techniques for decades to gauge the satisfaction and loyalty that their products and services deliver to their customers. Although significant basic science and practice has been created, administration and analysis of satisfaction and loyalty measurement instruments is lacking sophistication. Current state-of-the-art methods fall into two broad...

Claims


Application Information

Patent Timeline
Patent Type & Authority Applications(United States)
IPC IPC(8): G06Q10/00G06F17/11G06Q30/00
CPCG06Q10/06393G06Q30/0203G06Q30/0201G06Q30/00
Inventor GRAY, PETER M.TEAR, ALLANABRAMOV, ALEXSLAVIN, VADIM
Owner WHYDATA
Why Eureka
Eureka Blog
Learn More