
System and method for interactively displaying multi-dimensional data

a multi-dimensional data and interactive technology, applied in the field of interactive display multi-dimensional data, can solve the problems of difficult display and navigation, static nature of existing data diagrams, and limited conventional data diagrams

Inactive Publication Date: 2006-11-23
MICROSOFT TECH LICENSING LLC
View PDF9 Cites 79 Cited by
  • Summary
  • Abstract
  • Description
  • Claims
  • Application Information

AI Technical Summary

Benefits of technology

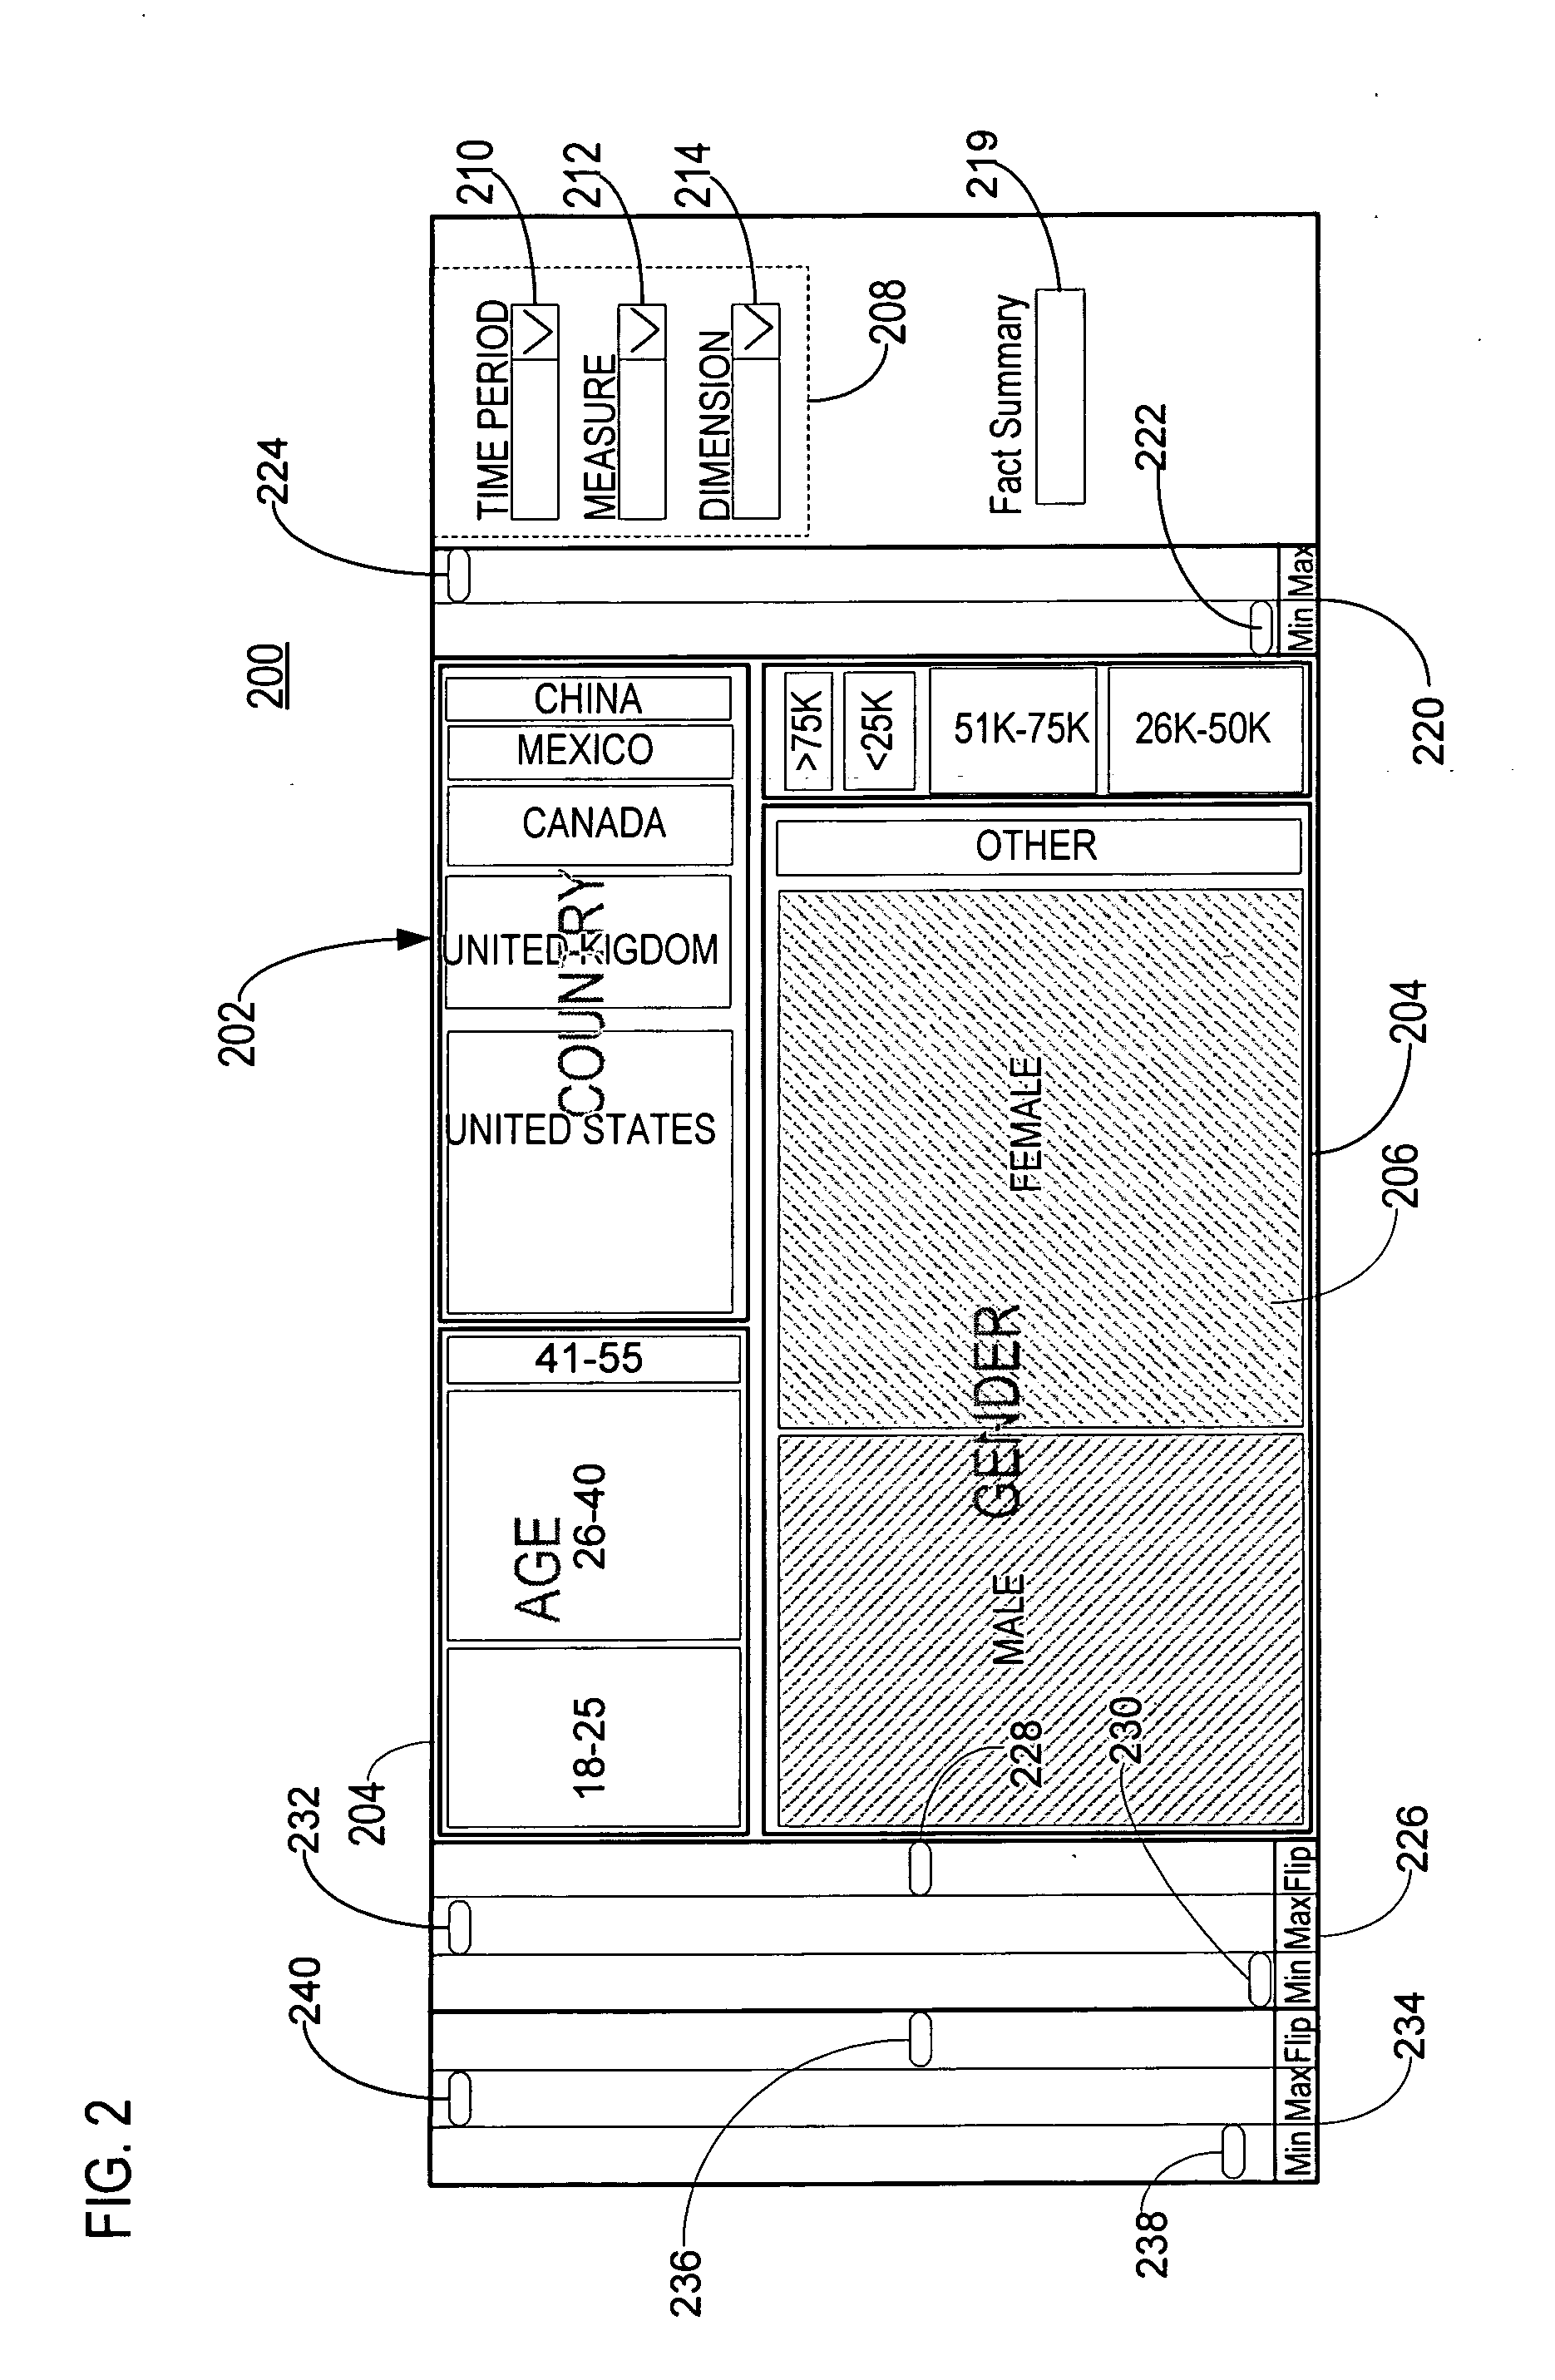
[0004] Embodiments of the invention overcome one or more deficiencies in the prior art by providing an interactive data diagram responsive to user input to dynamically modify organized levels being displayed in the data diagram. By providing an interactive data diagram, aspects of the present invention allow users to avoid additional data entry and readily identify and view additional detail regarding information in a multidimensional data set.

Problems solved by technology

Such multi-dimensional data sources often contain large amounts of data (e.g., up to and exceeding a terabyte of data) that can be difficult to display and navigate.
However, existing data diagrams are static in nature.
Moreover, conventional data diagrams are limited by their inability to interact with the user and provide an analysis of the data shown in the diagrams.

Method used


Image

  • System and method for interactively displaying multi-dimensional data
  • System and method for interactively displaying multi-dimensional data
  • System and method for interactively displaying multi-dimensional data

Examples


Embodiment Construction

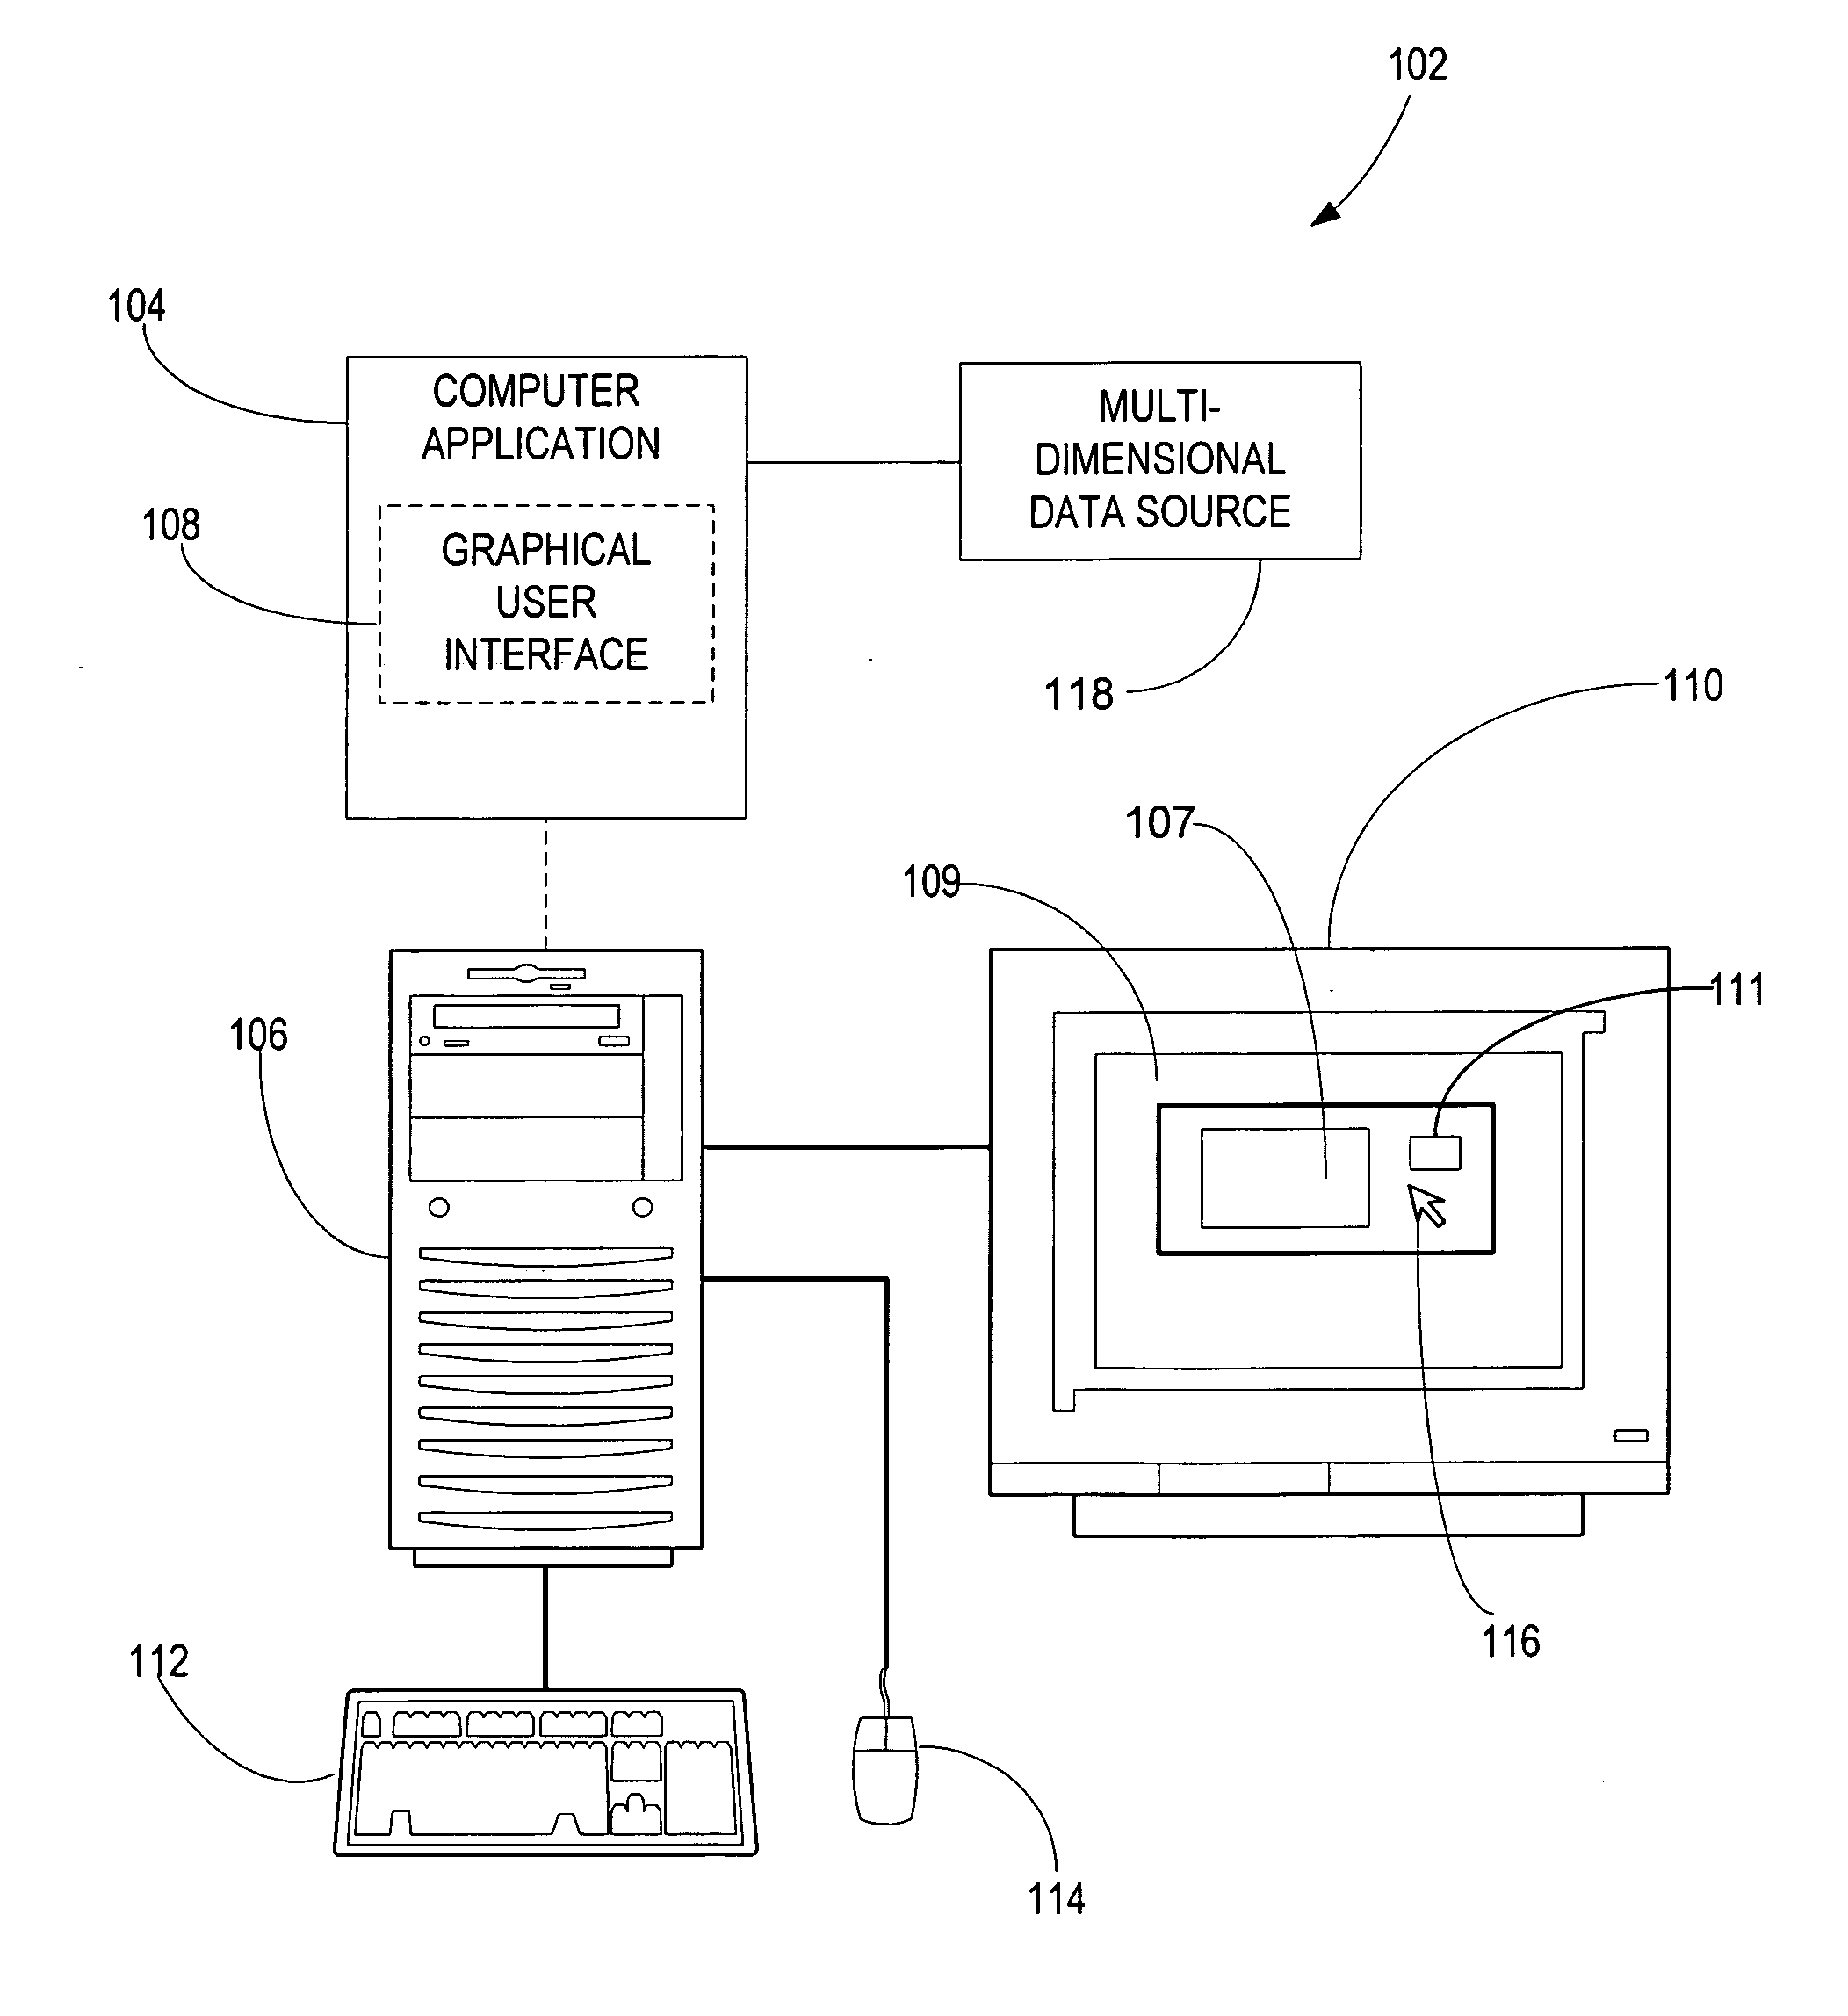
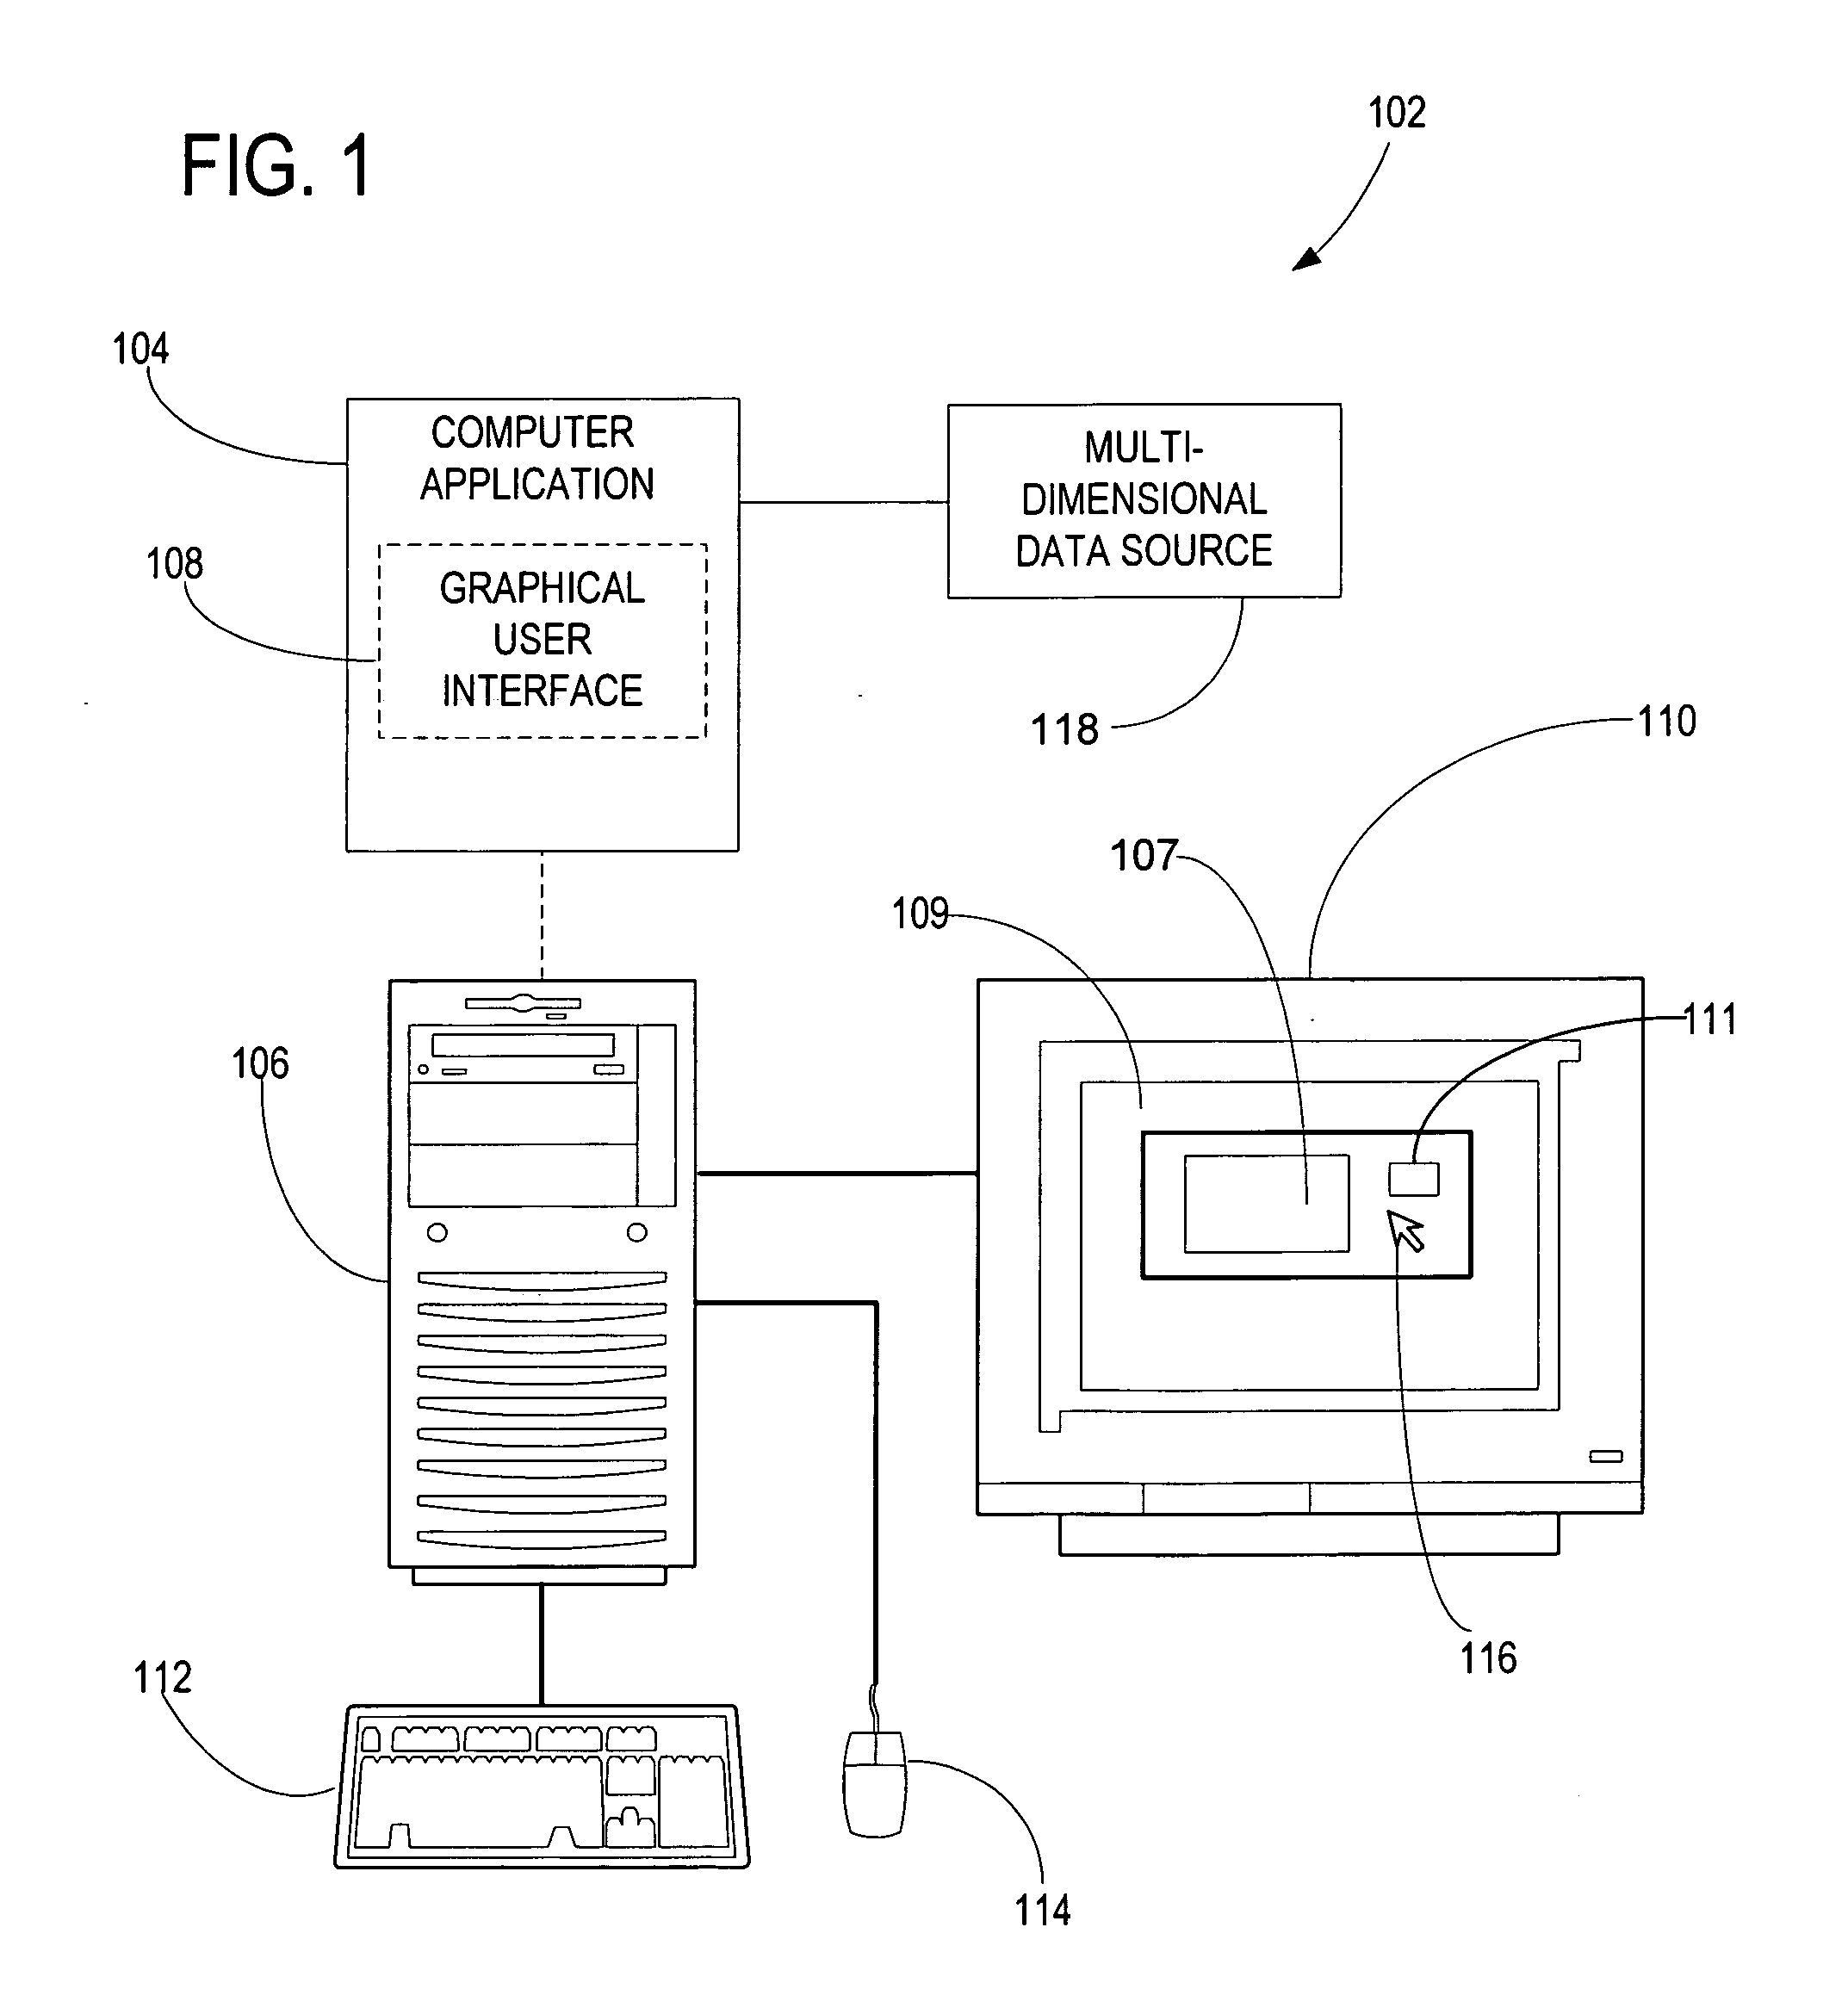
[0017]FIG. 1 illustrates basic components of a computer system 102 used in connection with one embodiment of the present invention. Aspects of the invention relate to a computer application 104 that, when executed by a computer 106, retrieves, multi-dimensional data, and presents an interactive data diagram 107 via a graphical user interface (UI) 108. The UI 108 is presented to a user on a computer display screen 109 of a monitor 110 of the computer system 102. The UI 108 is preferably implemented as part of an operating system that provides an environment for displaying and managing window objects of the operating system. For example, the UI 108 presents of control elements or components 111 such as text entry fields, list boxes, and scroll bars objects 120 on the display 109 that allow the user to perform a desired operation or define data to retrieve from the multi-dimensional data source for display via the data diagram 107.

[0018] Although the present invention is described in ...


PUM


Abstract

Methods and systems for displaying data retrieved from a multi-dimensional data source via an interactive data diagram. A graphical user interface is responsive to input from a user to retrieve multi-dimensional data for display via an interactive data diagram. The interactive data diagram displays multi-dimensional data in a hierarchical structure that includes a plurality of dimension levels and one or more member levels within each dimension level. A user specifies a change to the display structure by selecting a displayed member level in the hierarchical structure. The interactive data diagram is responsive to the user specified change to generate a drilled down data diagram displaying detailed dimension and member levels related to the selected member level.

Description

TECHNICAL FIELD [0001] The present invention relates to the field of. information retrieval and database processing. In particular, this invention relates to improvements in displaying and interacting with data diagrams displaying multi-dimensional data. BACKGROUND OF THE INVENTION [0002] Multi-dimensional data sources are commonplace in organizations worldwide. Such multi-dimensional data sources often contain large amounts of data (e.g., up to and exceeding a terabyte of data) that can be difficult to display and navigate. Data diagrams, such as tree maps, allow a user to view such data in organized levels. Displaying data in a hierarchy such as this provides an efficient means for viewing multi-dimensional data. However, existing data diagrams are static in nature. That is, once multi-dimension data is presented in the data diagram, the user cannot interact directly with the data diagram to dynamically modify its appearance. Rather, if the user desires to view additional detail r...

Claims


Application Information

Patent Timeline
Patent Type & Authority Applications(United States)
IPC IPC(8): G09G5/00
CPCG06Q10/10
Inventor ZHANG, BENYUMAH, TERESA B.WANG, LEEHESSELTINE RICHARDSON, JULIE L.
Owner MICROSOFT TECH LICENSING LLC
Learn More