
Method for displaying data on computer system

a computer system and data technology, applied in the direction of computer control, process and machine control, instruments, etc., can solve the problems of ineffective displaying method, inability to know how the f value is to be changed, and ineffective method,

Inactive Publication Date: 2002-02-28
IBM CORP
View PDF16 Cites 6 Cited by
  • Summary
  • Abstract
  • Description
  • Claims
  • Application Information

AI Technical Summary

Benefits of technology

[0008] Under such circumstances, it is an object of the present invention to provide a data displaying method that can solve the above conventional problems and make it easier to visualize data to be changed in dependence on a plurality of variables accurately, simply, and effectively. It is another object of the present invention to provide a computer system that carries out the data displaying method and a computer-readable recording medium that stores a program for carrying out the data displaying method.
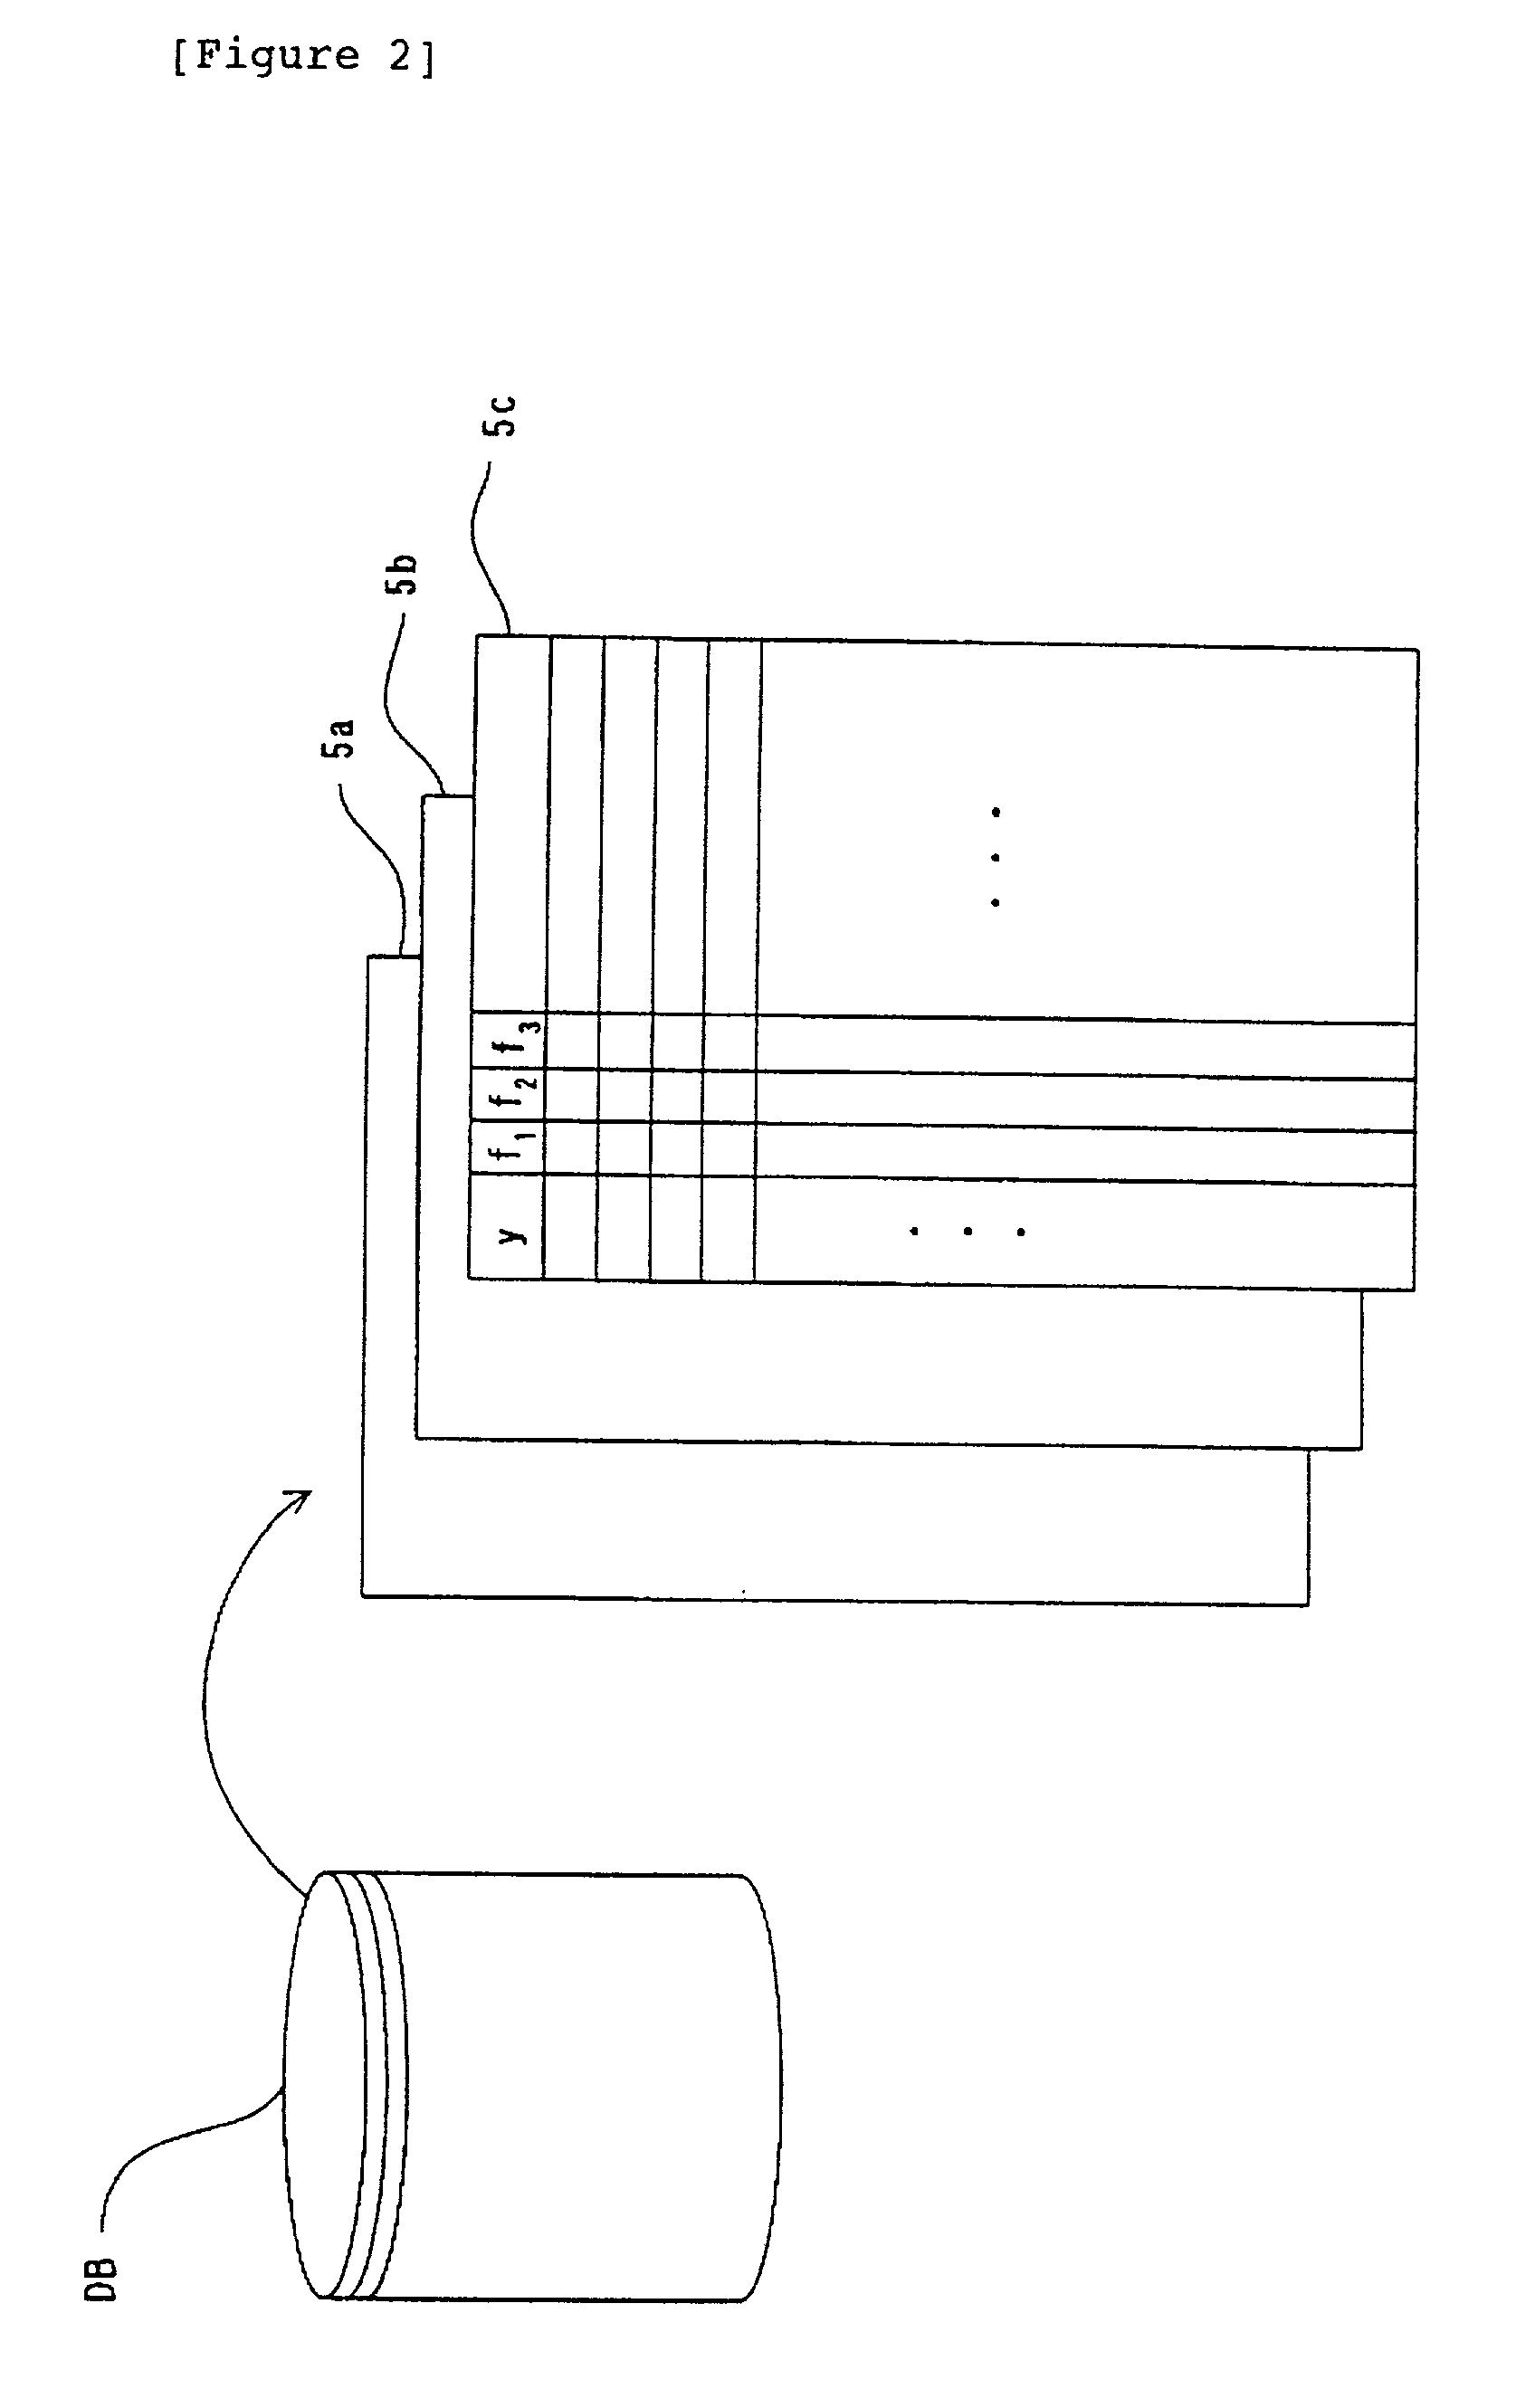
[0010] Concretely, the data displaying method of the present invention is carried out by a computer system that includes a computer with a database; a display device; and a pointer for entering a position on the screen of the display device. The data displaying method comprises a step of displaying a main graph by reading data from the database and plotting the data on the screen of the display device with respect to a first variable; a step of deciding whether or not an input from the pointer is a request for plotting data related to a second variable; a step of deciding coordinate data of a position of the main graph displayed on the screen of the display device; and a step of searching the coordinate data from the database. It is therefore possible to identify object data stored in the database accurately from the plotted main graph when it is displayed. Furthermore, in case an input from the pointer is a request for plotting data related to the second variable, the present invention enables the data displaying method to include a step of reading the coordinate data of the position from the database; a step of displaying a second window at a predetermined position on the screen of the display device that displays the main graph and a step of plotting the coordinate data of the position in the second window with respect to the second variable. This is why it is possible to sub-plot data including a data point identified accurately on the main graph according to a user request. The data displaying method can further include a step of displaying the second window while plotting of the data related to the second variable is requested from the pointer. Consequently, the data displaying method can stop the sub-plotting of data quickly in case the user does not need it any longer. The data displaying method of the present invention also enables the step of searching the coordinate data of a position in the database further include a step of calculating the coordinate value of the position so as to compare the value with the data value stored in the database. It is thus possible to identify any data stored in the database accurately from the coordinate data of the position on the main graph.

Problems solved by technology

This data displaying method can display the f value given by a plurality of variables two-dimensionally, but it has been confronted with a problem that it is impossible to know how the f value is to be changed in case x takes a value other than x.sub.0.
This conventional method arises a problem that the user must look away from the main graph in case he / she displays data on another screen, so that the displaying method is not effective so much.
The method, however, is not so effective, since it requires the user to use a mass of such calculating resources as a calculation time, a storage capacity, a processor (CPU), etc.
Because the method also creates a macro additionally so as to graph data in a spread-sheet program, etc., the procedures are complicated and this makes it difficult to display changes of the f value simultaneously according to the changes of a specific variable while data is plotted with respect to the main necessary parameters.

Method used


Image

  • Method for displaying data on computer system
  • Method for displaying data on computer system
  • Method for displaying data on computer system

Examples


Embodiment Construction

]

[0014] Hereunder, the preferred embodiments of the present invention will be described with reference to the accompanying drawings. The present invention is not limited only to those embodiments to be described below, of course; it may be modified freely without departing from the spirit of the invention.

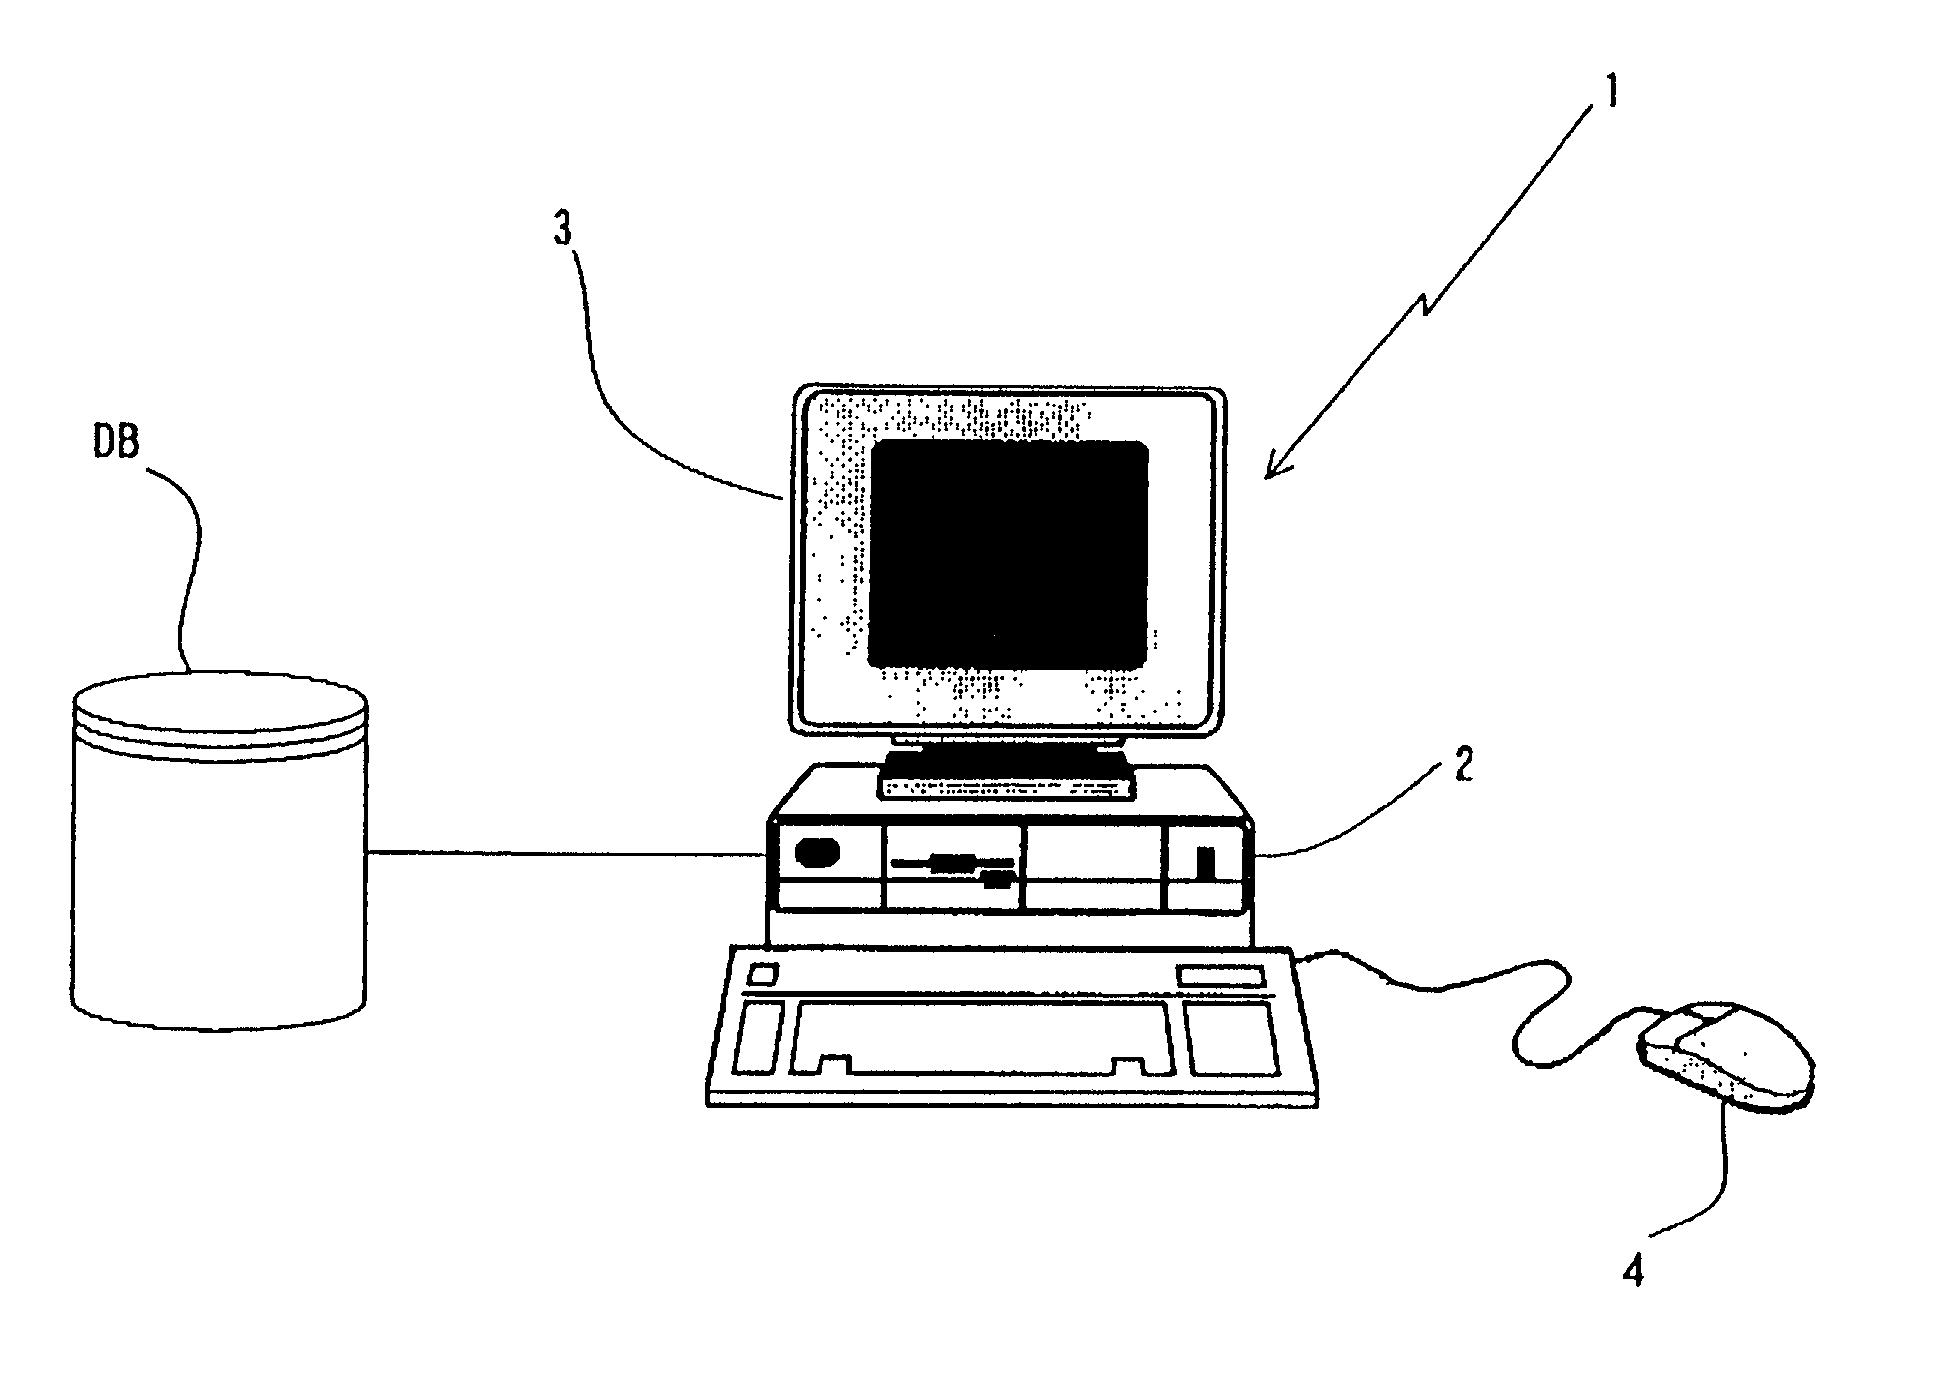
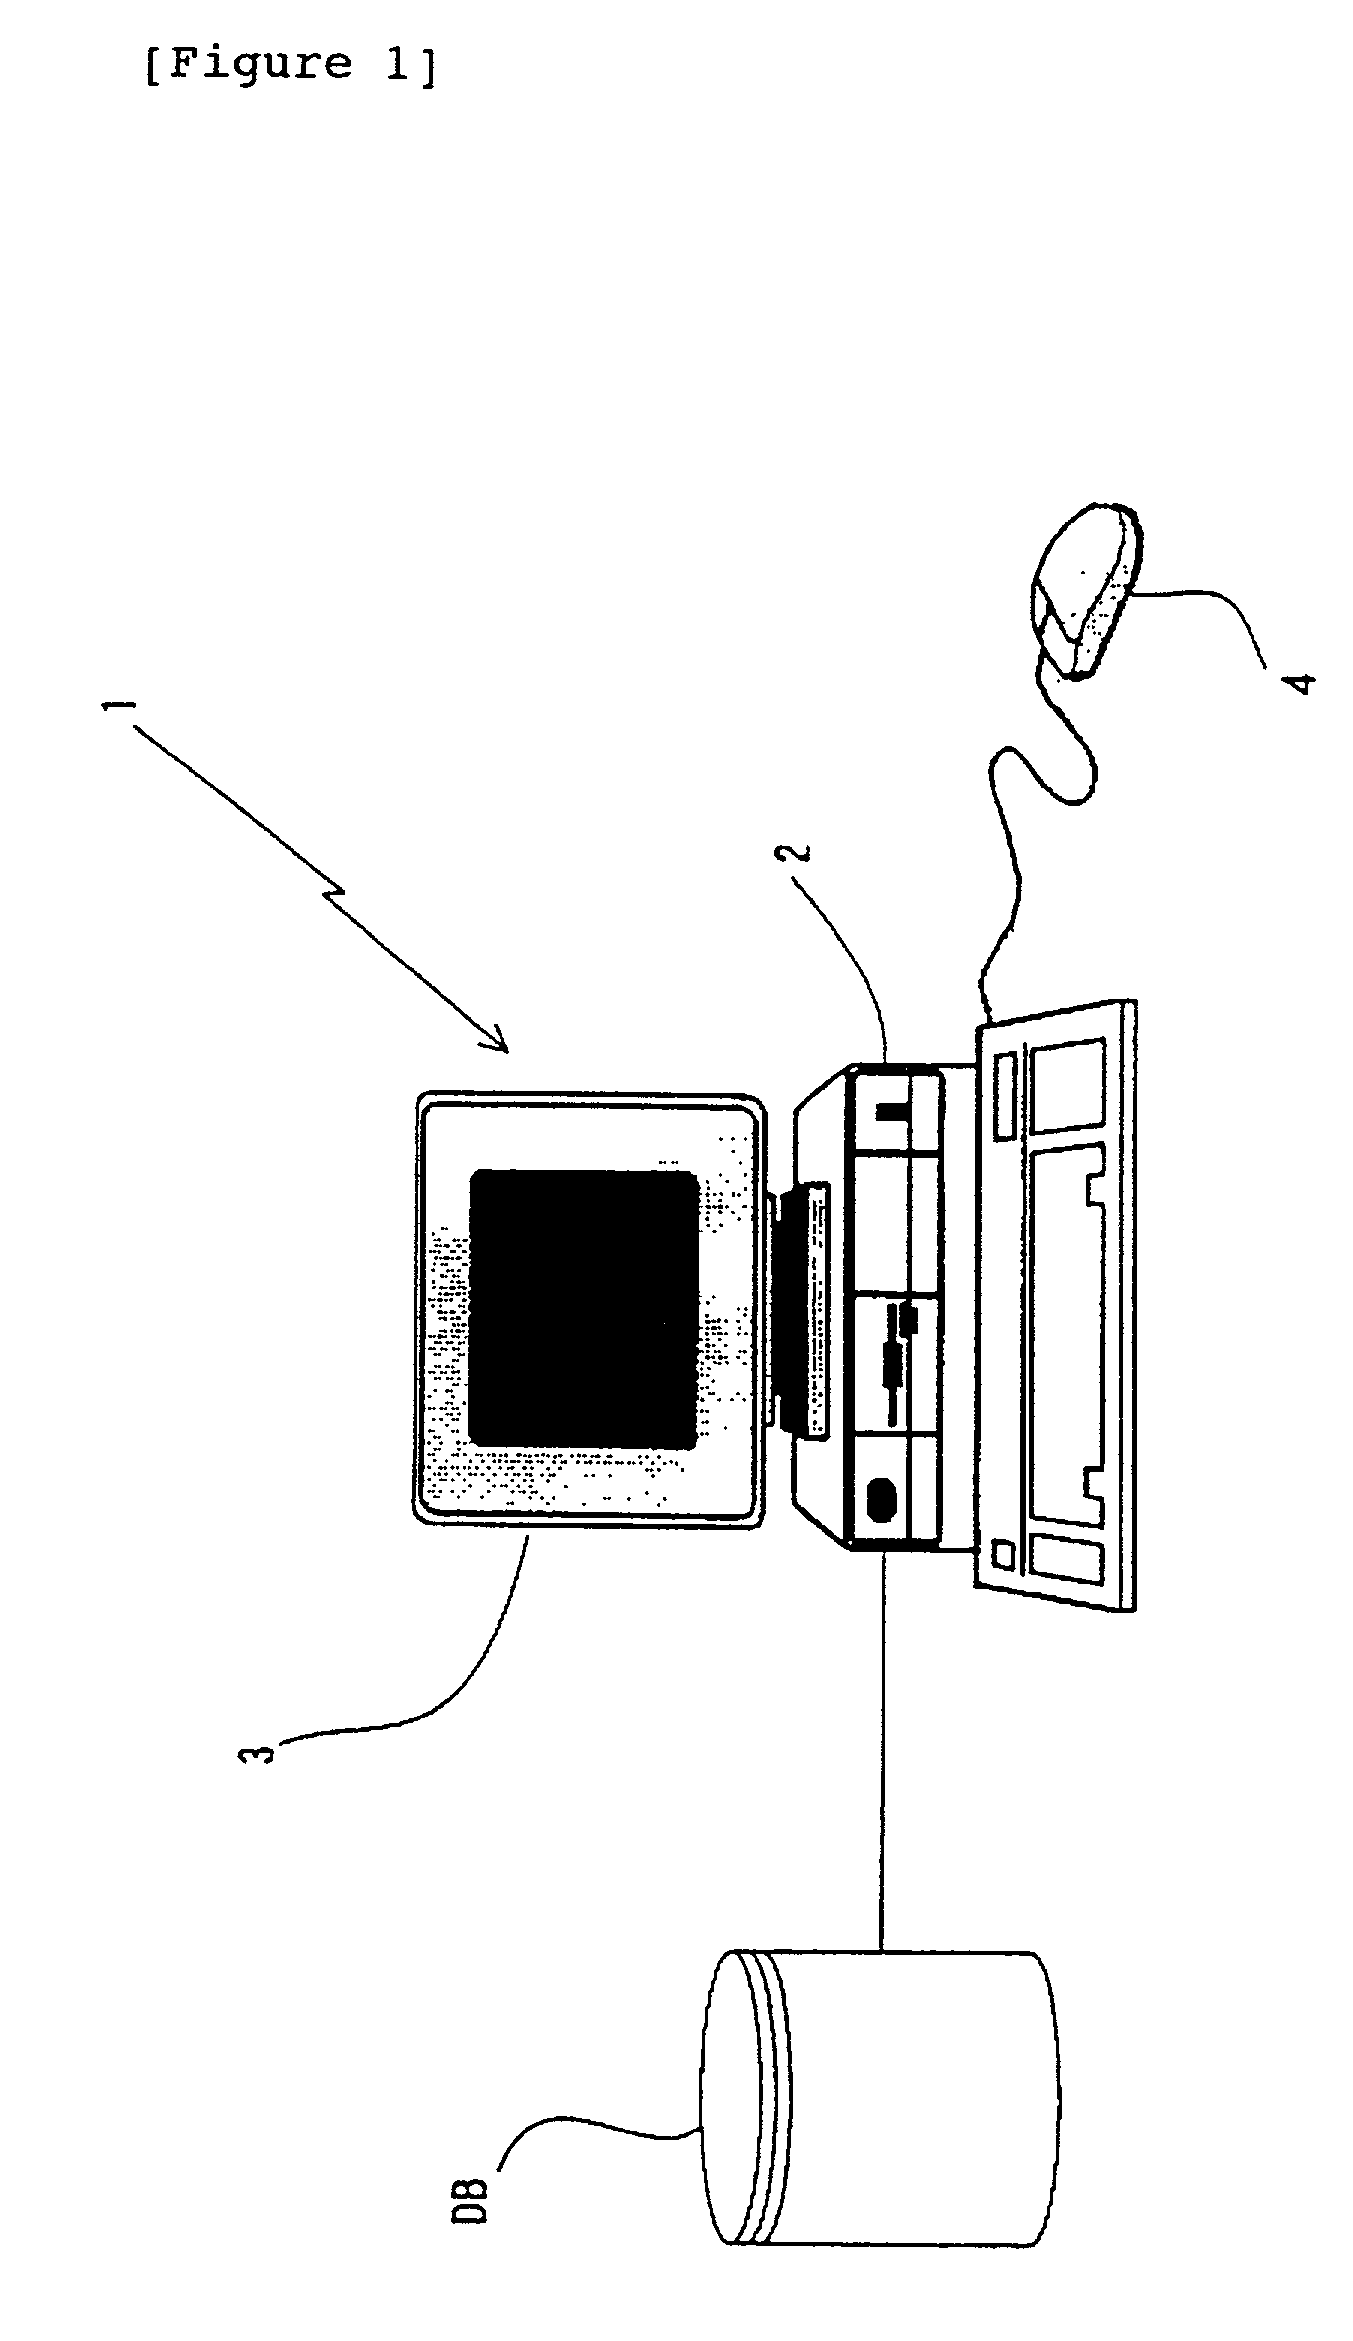
[0015] FIG. 1 shows an embodiment of a computer system for executing the data displaying method of the present invention. The computer system 1 is configured by computer means 2, a display device 3 connected to the computer means 2 and used to display various data items, and pointer means 4 for issuing a command for reading coordinate data as needed from the main graph displayed on the screen of the display device 3, as well as issuing other various commands. While the pointer means 4 is a mouse in FIG. 1, it may be a stylus pen. Especially, the present invention also enables the pointer means to be configured by, for example, a cross line formed on the screen of the display device...


PUM


Abstract

A data displaying method employed for a computer system that includes a computer means 2 with a database DB; display means 3; and pointer means 4 for entering a position on the screen of the display means 3. The method includes a step of reading data from the database DB and plotting the data on the screen of the display means 3 with respect to the first variable so as to plot a main graph; a step of deciding whether or not an input from the pointer means 4 is a request for plotting data related to the second variable; a step of deciding coordinate data of a position of the main graph displayed on the screen of the display means 3; and a step of searching the coordinate data from the database DB.

Description

[0001] 1 Field of the Invention[0002] The present invention relates to display of data stored in a database, more particularly to a data displaying method for displaying changes of data with respect to a plurality of variables in case changes of the data stored in the database depend on a plurality of the variables. The present invention also relates to a computer system for executing the method and a recording medium for storing a computer-readable program for executing the data displaying method.[0003] 2. Background Art[0004] There have been proposed many data displaying methods so far. Each of those methods displays data on a display screen by selecting it from among mass data stored in a database and plotting it with respect to target variables. For example, there is a well-known data displaying method. According to the method, in case data stored in a database is represented by a relationship of f=F(x, y), the x value is fixed to such a certain value as x.sub.0 and the f=F(x.su...

Claims


Application Information

Patent Timeline
Patent Type & Authority Applications(United States)
IPC IPC(8): G06T11/20G05B23/02G06F3/048G06F3/0484G09G5/36
CPCG06T11/206
Inventor IKAMI, SHINICHI
Owner IBM CORP
Learn More