Visibility Analysis Methods for Urban Areas

A technology of urban area and analysis method, applied in the field of visibility analysis of urban area, can solve the problems of complex building structure process and high calculation time cost, and achieve the effect of high reliability, high precision, and simple and fast analysis process

Active Publication Date: 2022-07-08
CENT SOUTH UNIV
View PDF4 Cites 0 Cited by
  • Summary
  • Abstract
  • Description
  • Claims
  • Application Information

AI Technical Summary

Problems solved by technology

Although the visual analysis results of this type of method are very accurate, the process of constructing the building structure is very complicated, and the time cost of calculation is too high

Method used


Image

  • Visibility Analysis Methods for Urban Areas
  • Visibility Analysis Methods for Urban Areas
  • Visibility Analysis Methods for Urban Areas

Examples


Embodiment Construction

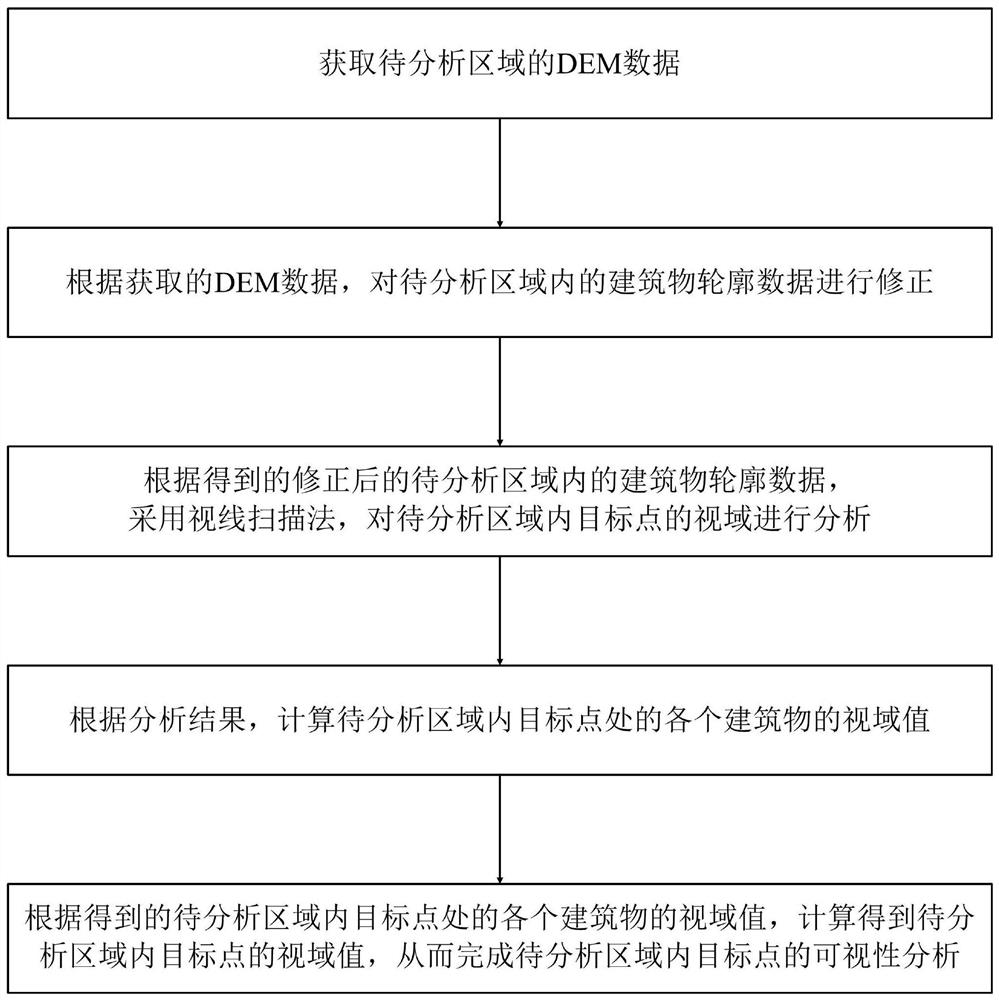
[0049] like figure 1 Shown is a schematic flow chart of the method of the present invention: the visibility analysis method of this urban area provided by the present invention includes the following steps:

[0050] S1. Obtain DEM data of the area to be analyzed;

[0051] S2. According to the DEM data obtained in step S1, the building outline data in the area to be analyzed is corrected; specifically, the following steps are used to correct:

[0052] A. Use the following formula to process the relative height of the acquired DEM data:

[0053] D i =D' i -min(D)

[0054] where D i is the processed DEM value; D′ i is the DEM value of the processing sign; min(D) is the minimum value in the DEM grid matrix;

[0055] B. Use the following principles to correct the building outline data in the area to be analyzed:

[0056] If a building is completely contained in a single DEM grid unit, the following formula is used to correct the contour data of the building: h id =height ...


PUM


Abstract

The invention discloses a visibility analysis method for an urban area, which includes acquiring DEM data of the area to be analyzed; revising building outline data in the area to be analyzed; Analyze; calculate the viewing area value of each building at the target point in the area to be analyzed; calculate the viewing area value of the target point in the area to be analyzed and complete the visibility analysis of the target point. The present invention adopts DEM data and building outline data for visibility analysis and visual field calculation, and takes into account the fine characteristics of vector data and the influence of fine granularity of regular grid elevation data on visual analysis results; therefore, the method of the present invention can The visibility of urban areas is analyzed, and the analysis process is simple and fast, with high precision and high reliability.

Description

technical field [0001] The invention belongs to the technical field of geospatial, and particularly relates to a visibility analysis method of an urban area. Background technique [0002] Visibility analysis is an important part of spatial analysis, also known as viewshed analysis or line of sight analysis. Viewshed analysis refers to the extent of the viewshed that is visible from one or more geospatial locations or to other spatial locations. Visibility analysis is an indispensable part of terrain analysis and is widely used in many fields, such as military analysis, landscape assessment, urban planning, and historical site investigation. [0003] Digital Elevation Model (DEM) is a digital representation of local surface morphological features, which can be expressed as a Regular Square Grid (RSG) or a vector-based Triangulated Irregular Network (TIN). ), the topographic information it contains is often used for visibility analysis. [0004] At present, there are three ...

Claims


Application Information

Patent Timeline
Patent Type & Authority Patents(China)
IPC IPC(8): G06T17/20
CPCG06T17/20Y02A30/60
Inventor 丁晨罗靓邓敏石岩
Owner CENT SOUTH UNIV
Why Eureka
Try Eureka