


Quick Research
Generate reliable direction feasibility study reports for your R&D in just a few steps.

Technical Q&A
Discover and master advanced knowledge NOW. Basics, ideas, possibilities, all at once.

Find Solutions
As an expert in R&D theories, this can generate solutions to your technical problems instantly.

Evaluate Feasibility
Analyze your overall solution with one click, know your potential R&D risks in advance.

Monitor Landscape
Get weekly tech updates, stay abreast of the latest tech innovations and key insights.
Data visualization device and method
A data and database technology, applied in the field of data processing, can solve the problems of long development cycle time and high use threshold, and achieve the effect of lowering the development threshold and improving development efficiency
- Summary
- Abstract
- Description
- Claims
- Application Information
AI Technical Summary
Problems solved by technology
Method used
Image

Examples
Embodiment 1
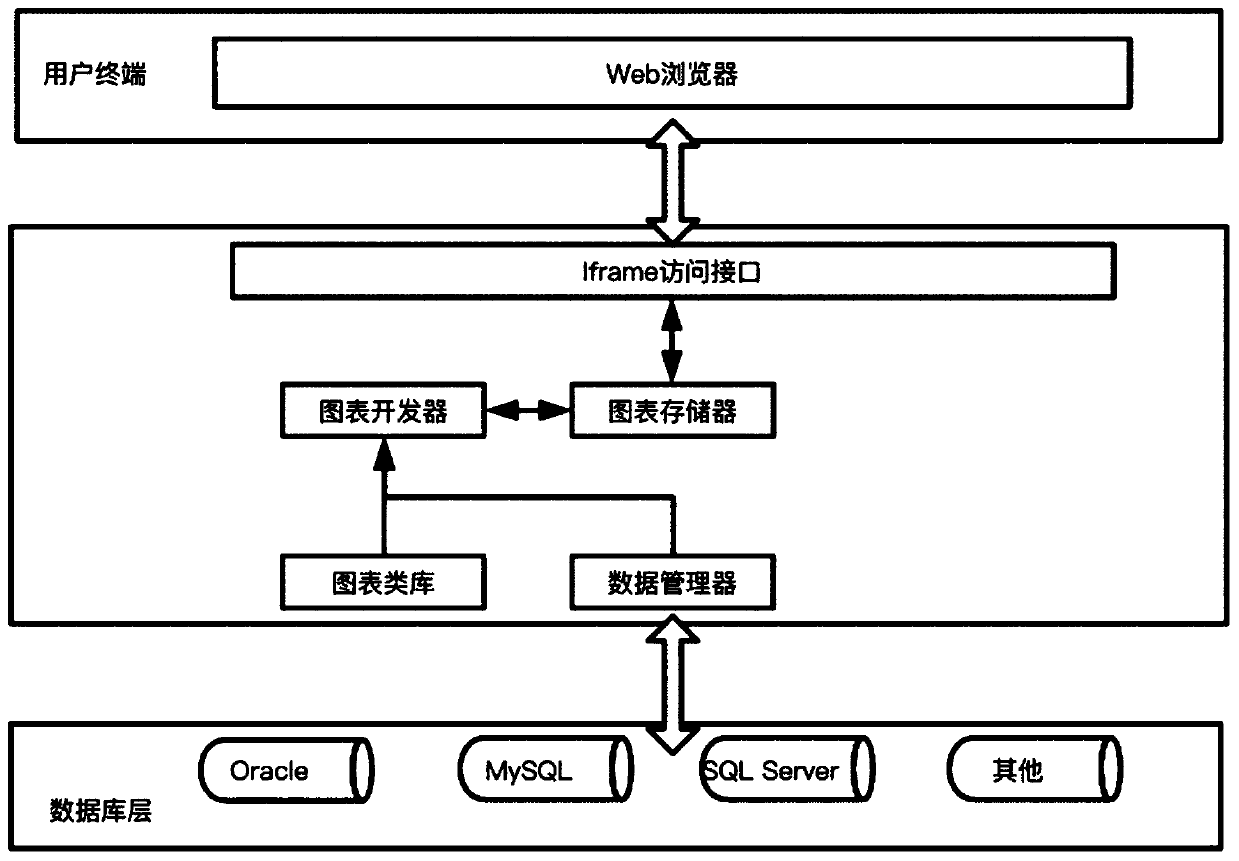
[0020] This embodiment provides a data visualization device, such as figure 1 As shown, it includes: the data management module, the user selects the data to be displayed through the data manager; the chart class library, the chart developer selects the chart type according to the data to be displayed; the chart development module, visualizes the selected chart type For development, generate a sub-HTML page corresponding to each visual chart, and embed the HTML page into another HTML page that needs to display data through the Iframe tag. The device in this embodiment changes the need for coding in the visualization development process, lowering the threshold for users to use, so that data visualization development can be carried out quickly and conveniently
[0021] Among them, the data management module includes a data manager and various databases. The data manager is used to retrieve data to be displayed from the database according to user needs; the database is used to st...
Embodiment 2
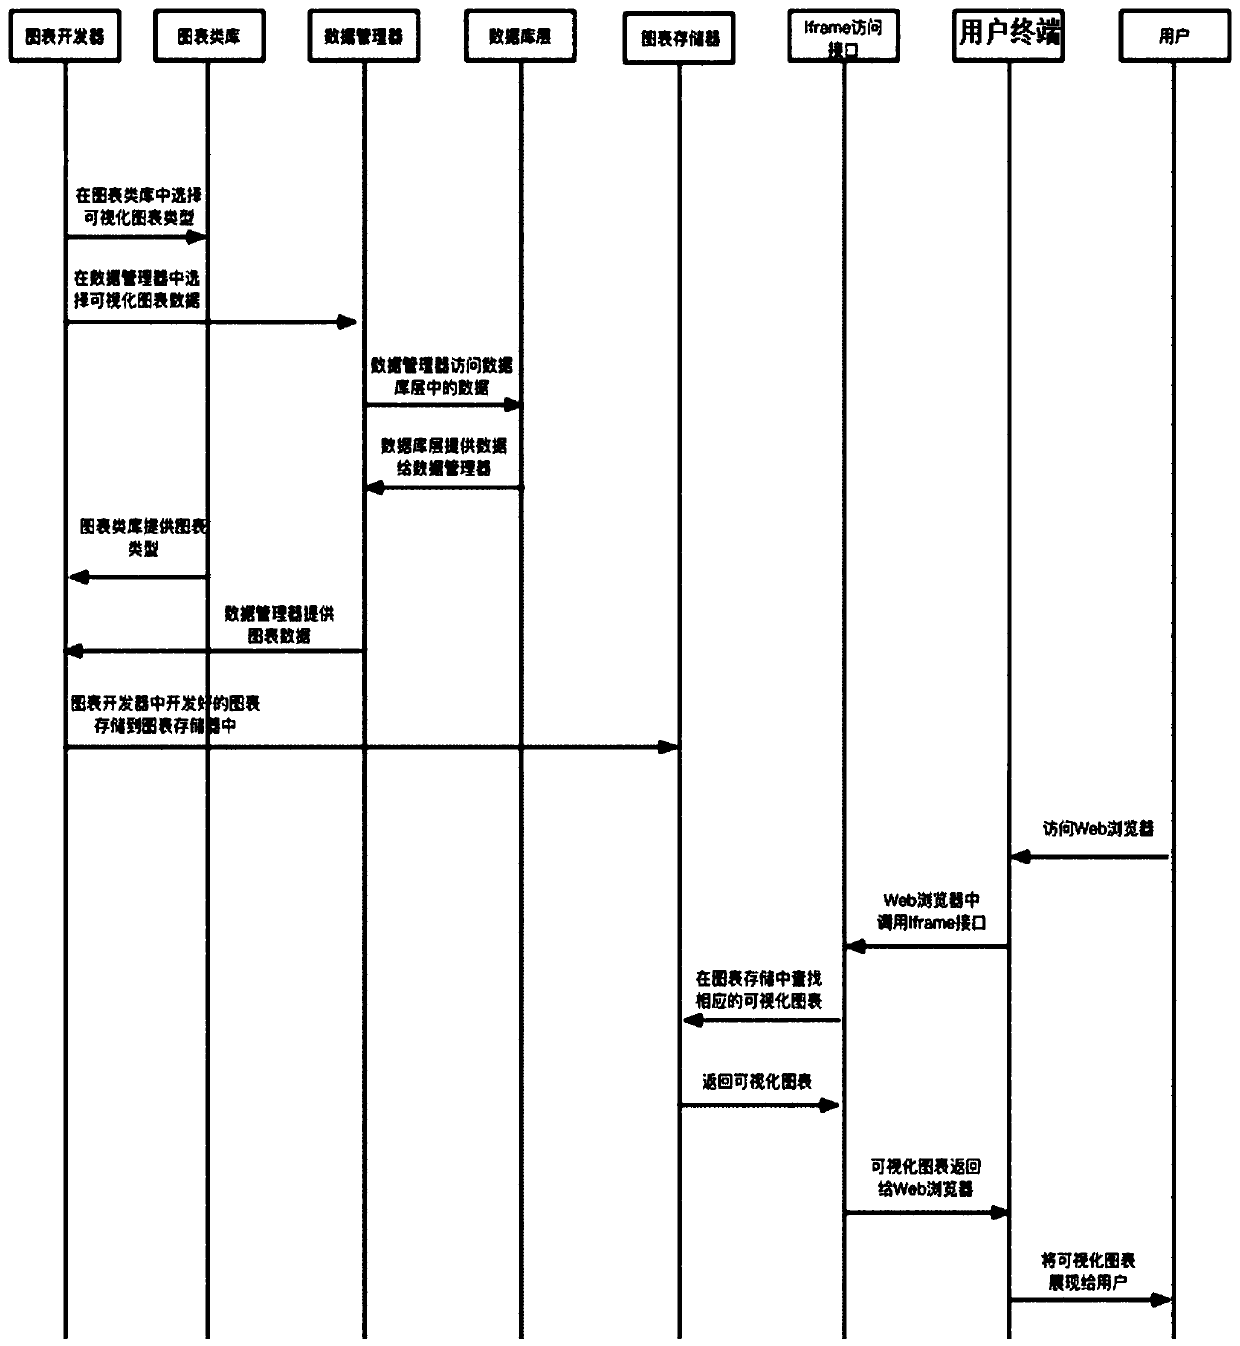
[0027] This embodiment discloses a data visualization method, such as figure 2 shown, including the following steps:
[0028] S1: Log in to any data visualization device in Embodiment 1;
[0029] S2: Use the data manager to select the data to be displayed in the visual chart, use the chart class library, select the type of chart to be displayed, and use the chart developer to develop the visual chart. The charts in the chart class library use Echart in the open source chart system , Chart.js components, some of which are self-developed with JavaScript language. The structure of the chart is defined in the chart class library, and the data in the chart can be configured by the user;
[0030] S3: The chart developer saves the developed chart as an HTML file, stores it in the chart memory, and based on the regulations of the HTML language, embeds the HTML file into other HTML files through the Iframe tag, and saves the chart HTML file to After the chart is stored, it will ret...
PUM
 Abstract
Description
Claims
Application Information
 - R&D Engineer
- R&D Manager
- IP Professional
- Industry Leading Data Capabilities
- Powerful AI technology
- Patent DNA Extraction
Browse by: Latest US Patents, China's latest patents, Technical Efficacy Thesaurus, Application Domain, Technology Topic, Popular Technical Reports.
© 2024 PatSnap. All rights reserved.Legal|Privacy policy|Modern Slavery Act Transparency Statement|Sitemap|About US| Contact US: help@patsnap.com