
Visual storm surge-sea wave coupling forecasting method

A storm surge and ocean wave technology, applied in forecasting, data processing applications, instruments, etc., can solve the problems of low degree of automation and operation efficiency, low degree of automation, unfriendly and intuitive display of forecast results, etc., to reduce workload, The effect of improving operating efficiency

Active Publication Date: 2019-08-06
INST OF OCEANOLOGY - CHINESE ACAD OF SCI
View PDF22 Cites 7 Cited by
  • Summary
  • Abstract
  • Description
  • Claims
  • Application Information

AI Technical Summary

Problems solved by technology

In the forecast of storm surge and sea wave, numerical simulation is a very important means, but the current numerical simulation basically adopts a single wave model or storm surge model, without considering the interaction between storm surge and sea wave
In addition, most of the current operational storm surge and wave models use orthogonal curve grids instead of unstructured grids, and the description of complex coastlines is not fine enough
[0003] Moreover, in the operational operation of storm surge and sea waves, the general steps are to first prepare the atmospheric forcing field, then run the numerical model, and finally analyze and draw the simulation results. The entire process is basically done manually, and the degree of automation is not high. Affects the forecasting efficiency, and when displaying the forecast results, the plane distribution map is used, and the display form is not intuitive and friendly enough
[0004] Therefore, the existing numerical forecasting methods have the problems of low degree of automation and operating efficiency, insufficient model resolution, imperfect physical mechanism, and unfriendly and intuitive display of forecast results.

Method used


Image

  • Visual storm surge-sea wave coupling forecasting method
  • Visual storm surge-sea wave coupling forecasting method
  • Visual storm surge-sea wave coupling forecasting method

Examples


Embodiment Construction

[0041] The following will clearly and completely describe the technical solutions in the embodiments of the present invention with reference to the drawings in the embodiments of the present invention.

[0042] The present invention provides a visual storm surge-ocean wave coupled forecasting method, including the following process:

[0043] (1) Based on the Scrapy framework, crawl and analyze the multi-threaded data released by the meteorological department to form forecast text, pictures and forecast data;

[0044] The specific method is as follows: figure 2 As shown, in the scheduler, information crawling is divided into three processes: text information acquisition, picture information acquisition, and typhoon information acquisition, and the orderly progress of each process is realized through the scheduler, and the webpage request is implemented in the downloader and returned The framework can identify the content of the document, and send the content to the informatio...


PUM


Abstract

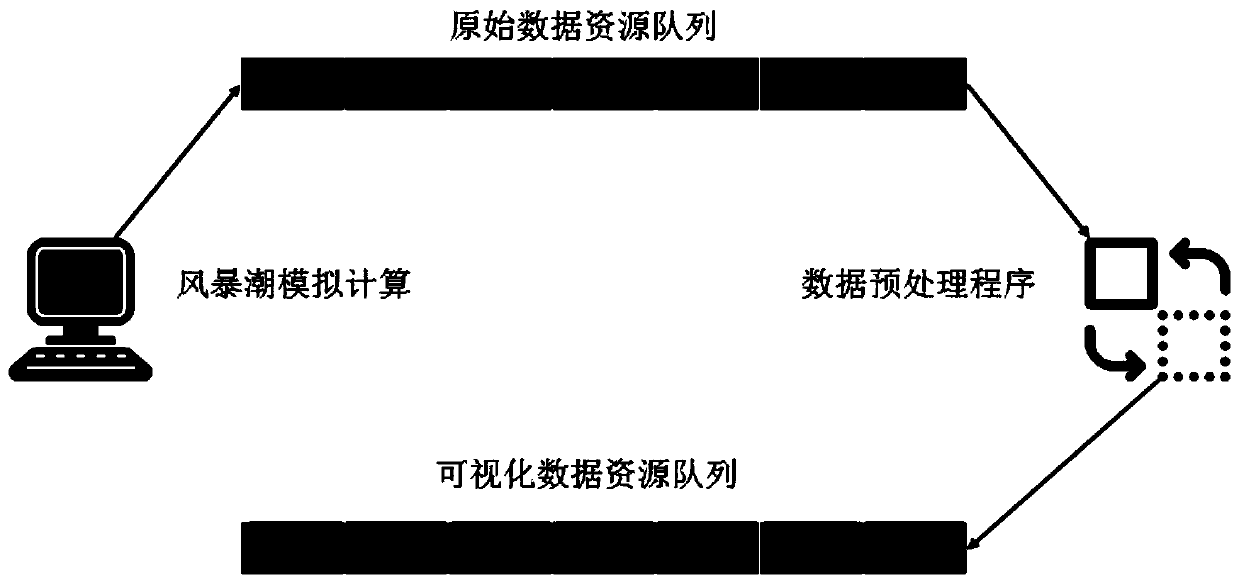
The invention discloses a visual storm surge-sea wave coupling forecasting method, which comprises the following steps: crawling and analyzing multi-thread data released by a meteorological departmentto form a forecasting text, a picture and forecasting data; storing prediction data in a PostgreSQL database; when a data increment is generated, enabling a data driving thread to send data and a starting command to a storm surge-sea wave coupling mode, starting operation of the coupling mode automatically, and after operation of the storm surge-sea wave coupling mode is completed, processing overcalculated data and outputting the processed data to a visual data resource queue;; and presenting a final result on the ocean sphere through a Leaflet-based particle visualization method and a raster data layer drawing method. According to the forecasting method disclosed by the invention, an automatic operation coupling mode can be realized, the efficiency of a forecasting system is improved, and a forecasting result is more visual and friendly.

Description

technical field [0001] The invention relates to a storm surge-sea wave coupling forecasting method, in particular to a visualized storm surge-sea wave coupling forecasting method. Background technique [0002] Both storm surges and ocean waves are marine processes driven by the atmosphere. They often occur simultaneously and interact with each other near the coast. When encountering extreme weather such as cold waves or typhoons, the two are likely to cause marine disasters. Numerical simulation is a very important means in the forecast of storm surge and sea waves, but the current numerical simulations basically use a single wave model or storm surge model, without considering the interaction between storm surge and sea waves. In addition, most of the current operational storm surge and wave models use orthogonal curved grids instead of unstructured grids, and the description of complex coastlines is not fine enough. [0003] Moreover, in the operational operation of storm...

Claims


Application Information

Patent Timeline
IPC IPC(8): G06Q10/04G06T15/00
CPCG06Q10/04G06T15/005Y02A90/10
Inventor 冯兴如王彦俊张斌李一凡尹宝树万纬祺
Owner INST OF OCEANOLOGY - CHINESE ACAD OF SCI
Learn More