Power grid project budget and progress control method based on a path analysis model
A path analysis and project technology, applied in the direction of calculation, instrumentation, data processing applications, etc., can solve the problems of power grid budget management and control means and progress early warning, unable to form control means, management difficulties, etc., to improve the completion rate of funds and the overall The level of budget management, the analysis process is simple and intuitive, and the effect of practice is obvious
- Summary
- Abstract
- Description
- Claims
- Application Information
AI Technical Summary
Problems solved by technology
Method used
Image
Examples
Embodiment
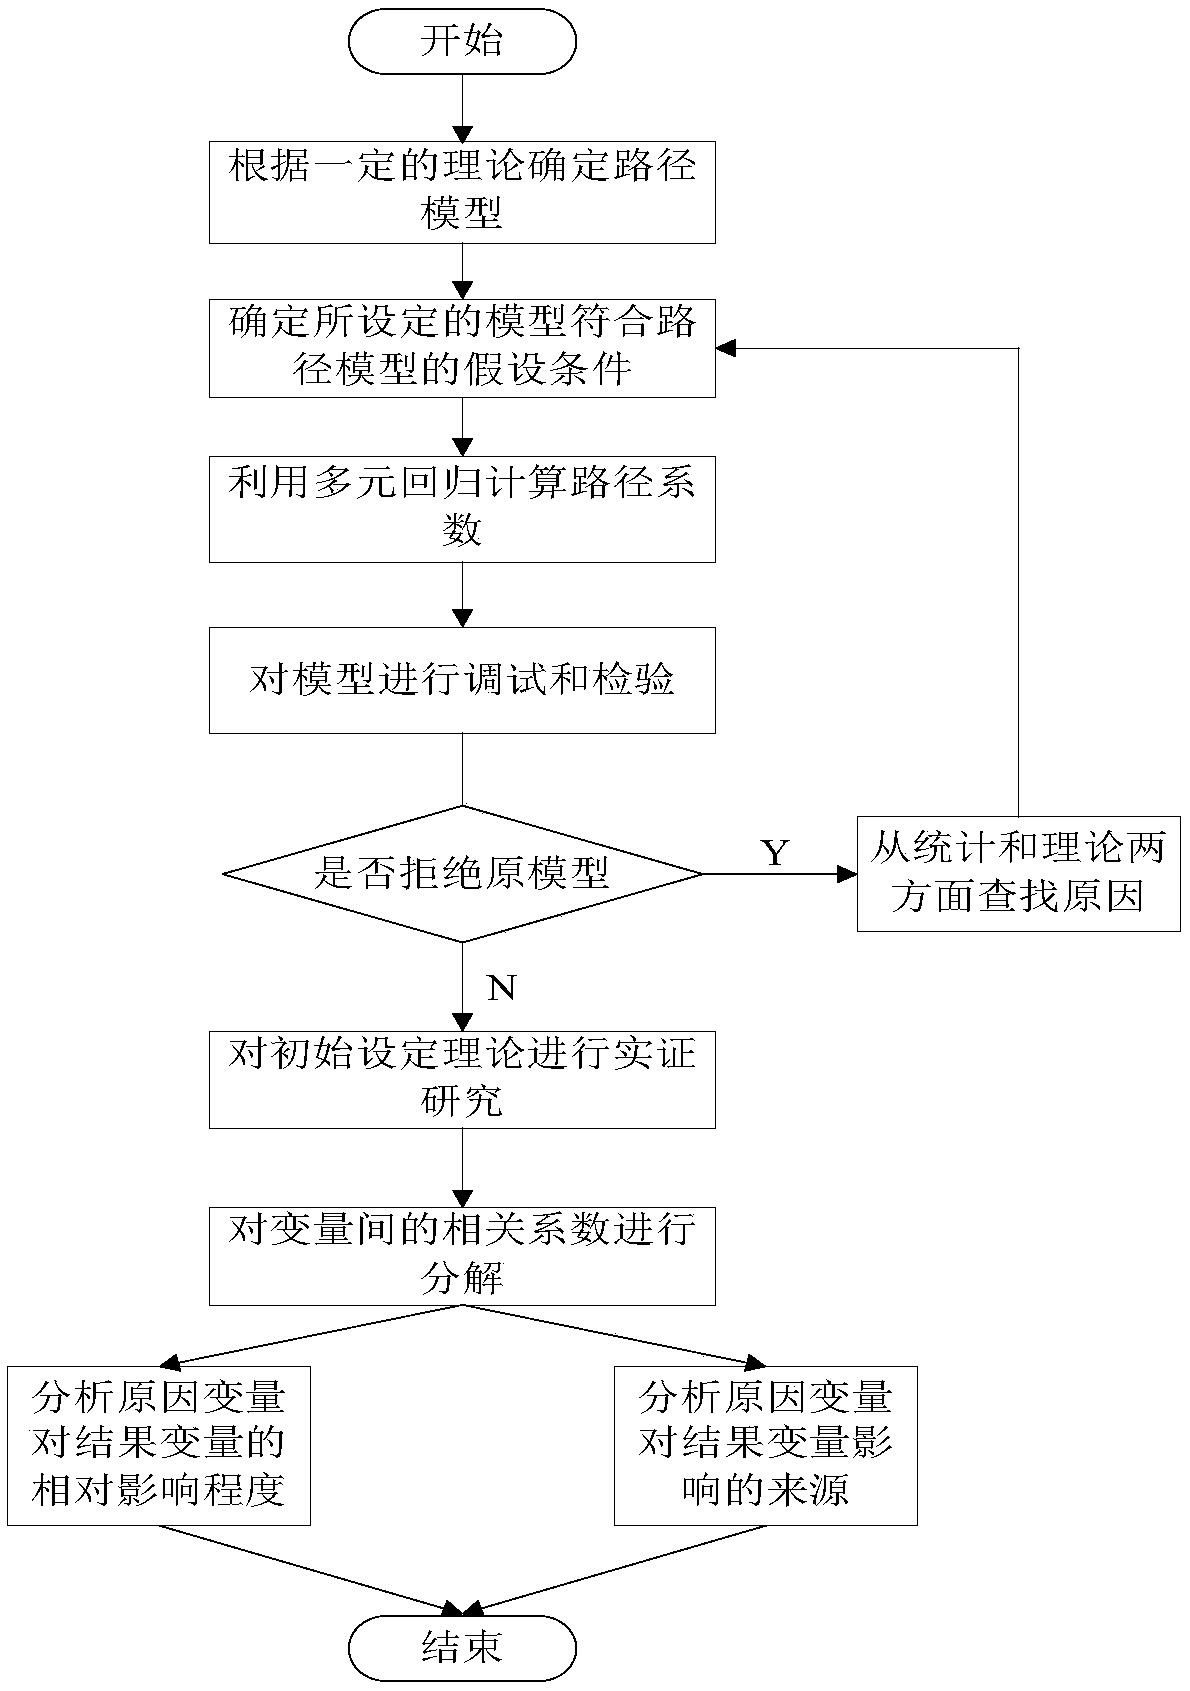
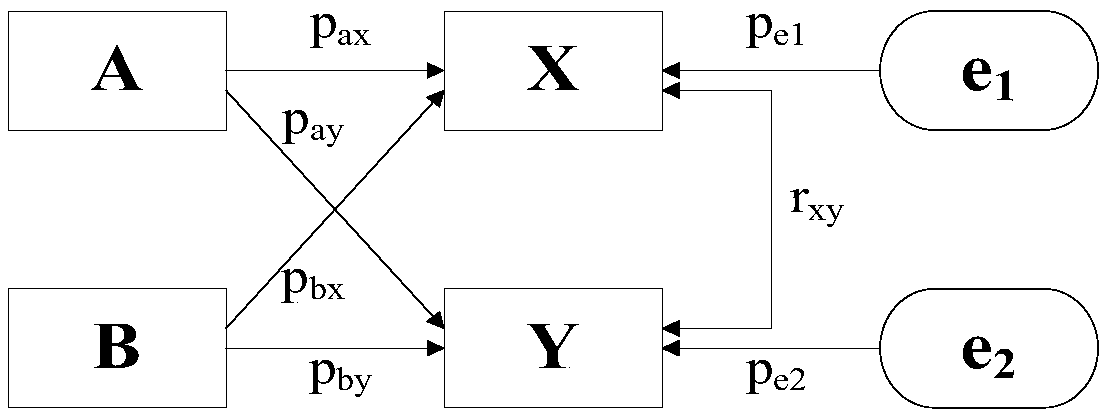
[0023] Such as Figure 1~4 As shown in the present invention, a power grid project budget and schedule management and control method based on a path analysis model is characterized in that the method includes the following steps: S1: first query projects over the years from the power grid production management system, and basically The information is exported to an excel sheet, and then in the ERP system, the completion of project funds is inquired in batches through the project code and the excel sheet is exported; S2: Then, the tables exported from the system are combined into an excel sheet with the project code as the identification field, and the data is stored in the excel sheet Data cleaning, and the basic information of the project will be completed by comparing with the comprehensive planning documents; S3: import the excel data sheet into SPSS software, and draw the box lines of the text-type independent variables such as project category, planning year, and professio...
Embodiment 2
[0045] This embodiment is optimized on the basis of Embodiment 1. In the excel data summary table after data cleaning, the 7 independent variables are all text variables except for the total investment of the project, which is for the convenience of subsequent path analysis , Regression operation, it is necessary to convert text variables into numerical variables through variable characteristics, descriptive comparison and linear trend of box plot.
[0046] Import the cleaned excel data sheet into SPSS software, and use the command "Analyze→Descriptive Statistics→Explore". Select "Fund Completion Rate" as the dependent variable and "Project Type" as the independent variable, conduct descriptive analysis and draw a box plot, as shown in Table 1,
[0047]
[0048] Table 1 Descriptive analysis of item type independent variables
[0049] According to the mean and median data in the descriptive table, combined with the visual display of the box plot, it can be concluded that: i...
PUM
 Abstract
Description
Claims
Application Information
 - R&D
- Intellectual Property
- Life Sciences
- Materials
- Tech Scout
- Unparalleled Data Quality
- Higher Quality Content
- 60% Fewer Hallucinations
Browse by: Latest US Patents, China's latest patents, Technical Efficacy Thesaurus, Application Domain, Technology Topic, Popular Technical Reports.
© 2025 PatSnap. All rights reserved.Legal|Privacy policy|Modern Slavery Act Transparency Statement|Sitemap|About US| Contact US: help@patsnap.com


