Limited-window length time frequency analysis method based on improved S-transformation
A time-frequency analysis and window length technology, applied in spectrum analysis/Fourier analysis and other directions to achieve high-resolution time-frequency analysis and strong flexibility
- Summary
- Abstract
- Description
- Claims
- Application Information
AI Technical Summary
Problems solved by technology
Method used
Image
Examples
Embodiment 1
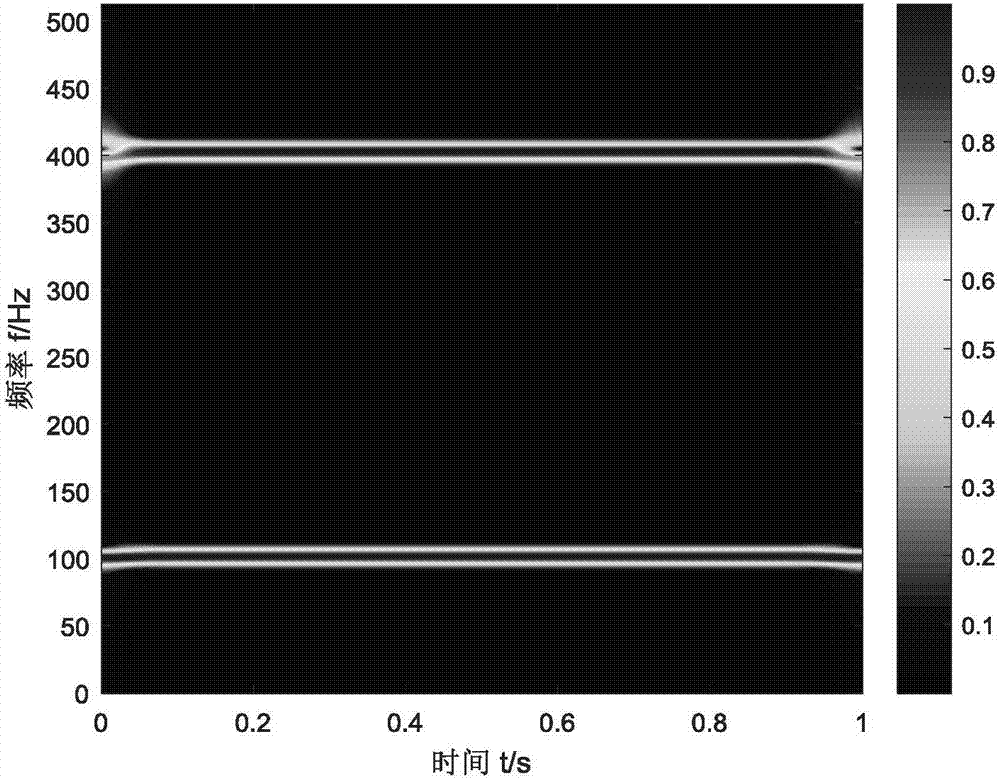
[0044] The simulation signal is the superposition of two sinusoidal signals, the signal frequencies are 100Hz and 400Hz respectively, and the analytical formula is:
[0045] h(t)=sin(200πt)+sin(800πt) t∈[0,1]
[0046] Signal sampling frequency f s =1024Hz, image 3 It is the time-frequency spectrum obtained by the finite-window time-frequency method using arctangent function combined with S-transform. The signal has only two fixed frequency components. For the signal whose frequency does not change with time, only the frequency resolution needs to be considered. Therefore, by adjusting the control factor, take a=1, b=50, c=30 to control the frequency window width at a relatively low In a small range, the time spectrum is guaranteed to have better frequency resolution performance. Depend on image 3 It can be seen that this method can achieve very good frequency resolution.
Embodiment 2
[0048] The simulation signal is a linear frequency modulation signal with a frequency modulation slope of k=400, and the analytical formula is:
[0049]
[0050] Signal sampling frequency f s = 1024Hz, Figure 4 In order to use the arctangent function combined with the S-transform finite window length time-frequency method to analyze the chirp signal. For the chirp signal, the frequency changes greatly, so adjust the control factor, take a=5, b=50, c=50 can be The analysis results shown in the figure are obtained, which solves the problems of signal divergence and poor energy aggregation at high frequencies of the original S-transform, and has good time-frequency performance.
Embodiment 3
[0052] The simulation signal is a non-linear frequency modulation signal whose frequency changes sinusoidally, and the analytical formula is:
[0053] h(t)=e j2π[6cos(10πt)+260t] t∈[0,1]
[0054] Signal sampling frequency f s = 1024Hz, Figure 5 It is the time-frequency diagram obtained after the non-linear frequency modulation signal h(t) is processed by the method of the present invention, because the signal frequency changes sinusoidally with time, so the requirement for time resolution is relatively high, and the minimum value control factor c should be relatively large , adjust the control factor, from the time-frequency results when a=6, b=50, and c=100, you can clearly see the track of frequency change with time, which has good time-frequency analysis performance.
PUM
 Abstract
Description
Claims
Application Information
 - R&D
- Intellectual Property
- Life Sciences
- Materials
- Tech Scout
- Unparalleled Data Quality
- Higher Quality Content
- 60% Fewer Hallucinations
Browse by: Latest US Patents, China's latest patents, Technical Efficacy Thesaurus, Application Domain, Technology Topic, Popular Technical Reports.
© 2025 PatSnap. All rights reserved.Legal|Privacy policy|Modern Slavery Act Transparency Statement|Sitemap|About US| Contact US: help@patsnap.com


