
A graphical method for presenting the matching of student orientation with universities (major groups) and majors

A technology of professional groups and colleges, applied in the field of graphics showing the matching of students' positioning with colleges (professional groups) and majors, and can solve problems such as difficult to achieve intuitive and clear performance, limitations, etc.

Active Publication Date: 2020-12-18
上海赢帆信息技术有限公司
View PDF7 Cites 0 Cited by
  • Summary
  • Abstract
  • Description
  • Claims
  • Application Information

AI Technical Summary

Problems solved by technology

However, the table is subject to many limitations in expressing the relationship and comparison between multi-dimensional scores, making it difficult to achieve intuitive and clear representation

Method used


Image

  • A graphical method for presenting the matching of student orientation with universities (major groups) and majors

Examples


Embodiment Construction

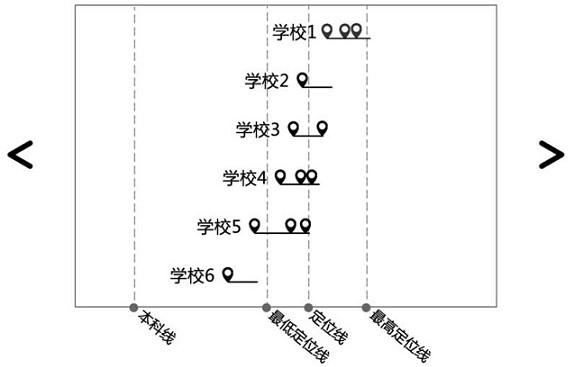
[0016] In a preferred embodiment of the present invention, there is provided a graphical method for presenting the matching situation of student positioning and colleges (professional groups) and majors, that is, the rainbow diagram, which is characterized in that the steps include:

[0017] S1: In the "rainbow map", obtain various scores that need to be referred to, set reference lines on the abscissa of the rainbow map, and each reference line will vertically divide the "rainbow map";

[0018] S2: Based on the basic information and grade information provided by the students, according to the algorithm rules, the positioning results are presented in the form of positioning lines, and 3 "positioning lines" are marked on the coordinate axes; Algorithm, the score intervals of the highest-scoring majors and high and low-scoring majors of colleges and universities (professional groups) are presented in the form of "rainbow lines", and all the enrollment majors are marked on the "ra...


PUM


Abstract

The present invention provides an illustration method, namely, the rainbow for presenting matching between student orientation, and colleges and universities (the major group) and majors. The method comprises: obtaining an abscissa reference line of various reference scores, a positioning line for presenting a positioning result, a rainbow line and a rainbow point, as well as left and right flip keys and other primary graphic elements, and setting a complete set of steps. Compared with the prior art, the method provided by the present invention enables students to more intuitively and conveniently lock the appropriate colleges and universities(the major group) and majors by using intuitionistic representation through data visualization; the "rainbow" is used to present the presenting matching between student orientation, and colleges and universities(the major group) and majors, so that not only score information in multiple dimensions can be fully showed, but also the relationship between multiple dimensions can be showed; and the students can further use and correct the self-strategy of filling the voluntary of college entrance examination by adjusting the view means of the ''rainbow'', and dynamic presentation of the ''rainbow'' makes the strategies of ''going forward'', ''keeping stable'', and ''making a guarantee'' be visualized.

Description

technical field [0001] The invention relates to the visualization of positioning data adopted by the college entrance examination score positioning system, belongs to the category of innovative education in the field of computer applications, and in particular relates to a graphical method for presenting the matching situation between student positioning and colleges (professional groups) and majors. Background technique [0002] When colleges and universities (professional group) enroll, it involves the admission line and admission line of the university (professional group), and the admission line and admission line of majors. When students consider colleges (professional groups) and majors to fill in, they need to consider the matching degree of personal achievements with colleges (professional groups) and majors, so as to adopt certain strategies to fill in the college entrance examination volunteers. For students, compare their own scores (average score, highest score, ...

Claims


Application Information

Patent Timeline
Patent Type & Authority Patents(China)
IPC IPC(8): G06F16/901
CPCG06F16/9024
Inventor 邱磊
Owner 上海赢帆信息技术有限公司
Learn More