A reliability assessment method for distribution network consisting of photovoltaic power generation microgrid
A technology for photovoltaic power generation and distribution network, which is applied in the field of electric power and can solve the problems of not considering the influence of the reliability of the power supply and distribution network.
- Summary
- Abstract
- Description
- Claims
- Application Information
AI Technical Summary
Problems solved by technology
Method used
Image
Examples
Embodiment
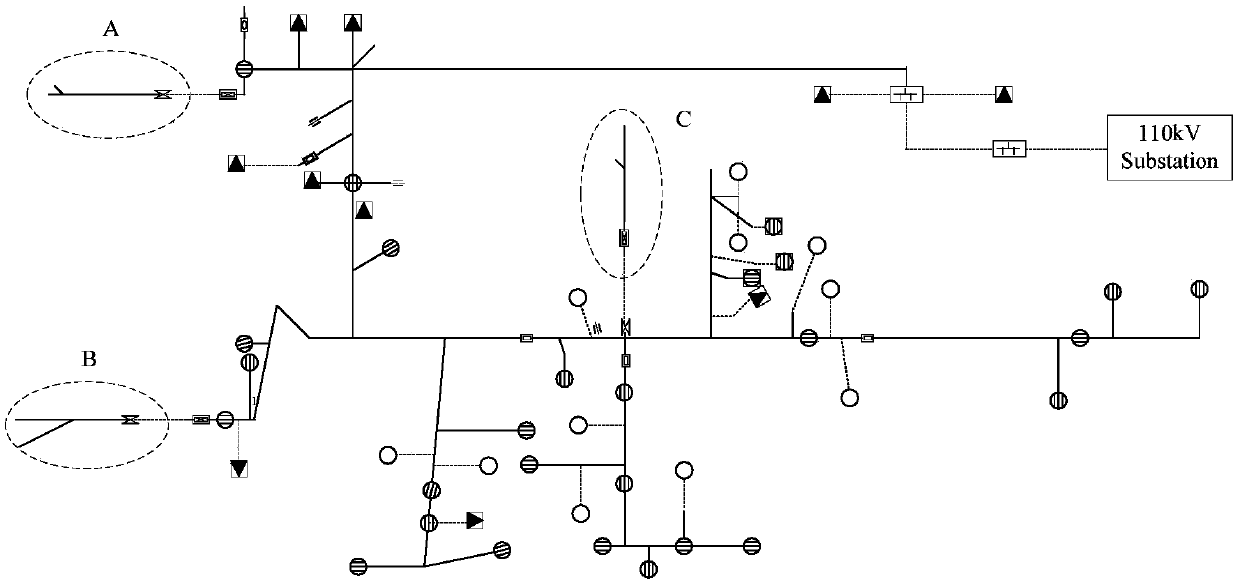
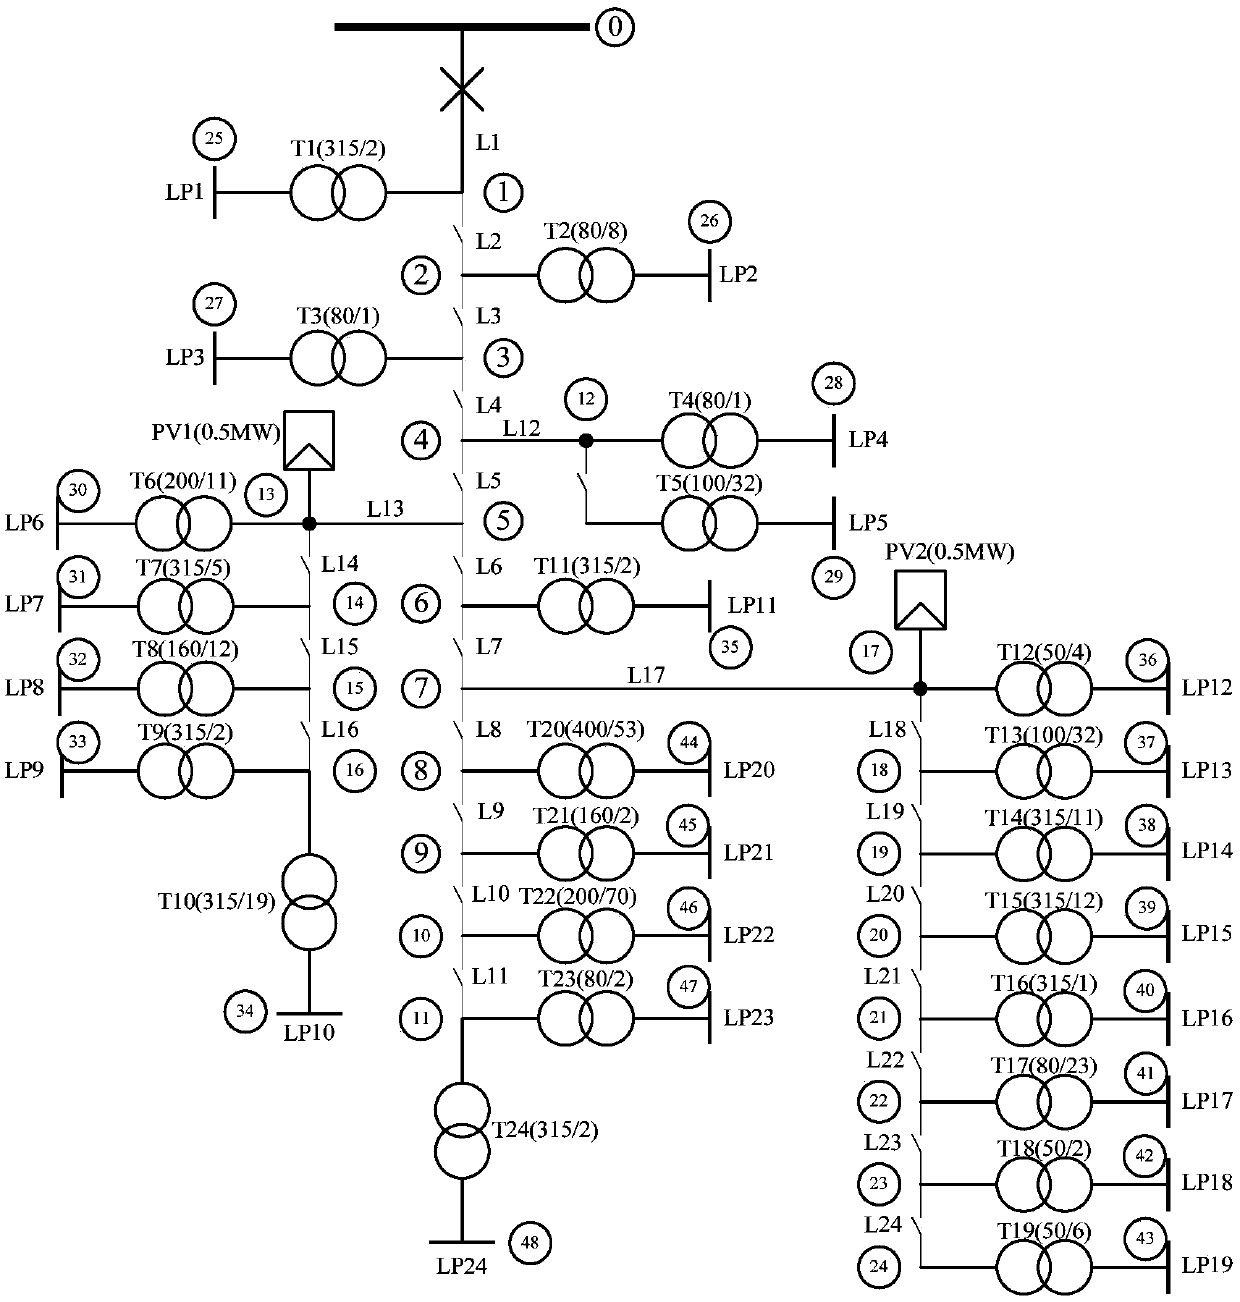
[0164] This embodiment includes a 10kV power distribution line in a certain area in northern my country, and its grid structure is as follows figure 2 As shown, there are 3 forwarding peers in this line; after simplification, the simplified topology diagram is as follows Figure 3a shown.
[0165] The distribution network includes 49 nodes (node 0 to node 48), 24 distribution transformers (T1 to T24), 24 load points (LP1 to LP24) and 24 connecting lines (L1 to L24). Figure 3a L1~L11 in the middle form the main feeder line of the distribution network, and the branches formed by the other lines or distribution transformers are all branch lines, and the distribution transformer is marked with the name of the transformer, rated capacity (kVA) and the number of users , For example, T1(315 / 2) means: the rated capacity of the distribution transformer T1 is 315kVA, and the transformer supplies power to 2 households. The total distribution transformer capacity in the distribution...
Embodiment 1
[0167] The daily maximum load variation curve in one year of the embodiment is as follows Figure 4 As shown in Table 1, according to the typical daily load rate statistical table in this area, the typical daily load rate change curve is obtained; the distribution network is obtained by fitting the daily maximum load change curve and the typical daily load rate change curve in a year The hourly load change curve of each load point in a year, such as Figure 5 shown.
[0168] Table 1 Typical daily load rate statistics table of the embodiment
[0169]
[0170] The load change of each load point should be similar to the load change of the entire 10kV distribution line. Considering here for simplicity, the shape of the load curve of each load point is the same as that of the total load curve, and the amplitude is based on the distribution transformer installed at each load point. Ratio distribution of total distribution transformer capacity.
[0171] Step 2, establishing the...
PUM
 Abstract
Description
Claims
Application Information
 - R&D
- Intellectual Property
- Life Sciences
- Materials
- Tech Scout
- Unparalleled Data Quality
- Higher Quality Content
- 60% Fewer Hallucinations
Browse by: Latest US Patents, China's latest patents, Technical Efficacy Thesaurus, Application Domain, Technology Topic, Popular Technical Reports.
© 2025 PatSnap. All rights reserved.Legal|Privacy policy|Modern Slavery Act Transparency Statement|Sitemap|About US| Contact US: help@patsnap.com


