Apparatus, method, and program for calculating explanatory variable values
a technology of explanatory variables and programs, applied in the field of apparatus, a method and a program for calculating explanatory variables, can solve the problem of less likely to obtain a highly precise statistical model, and achieve the effect of high precision and simplicity of a statistical model
- Summary
- Abstract
- Description
- Claims
- Application Information
AI Technical Summary
Benefits of technology
Problems solved by technology
Method used
Image
Examples
first embodiment
Credit Evaluating Model Through Logistic Regression Analysis
[0023]A statistical model for evaluating the probability of default of a business or individual is referred to as a “credit evaluating model”. A business or person, evaluated as being less likely to default, can be more reliable.
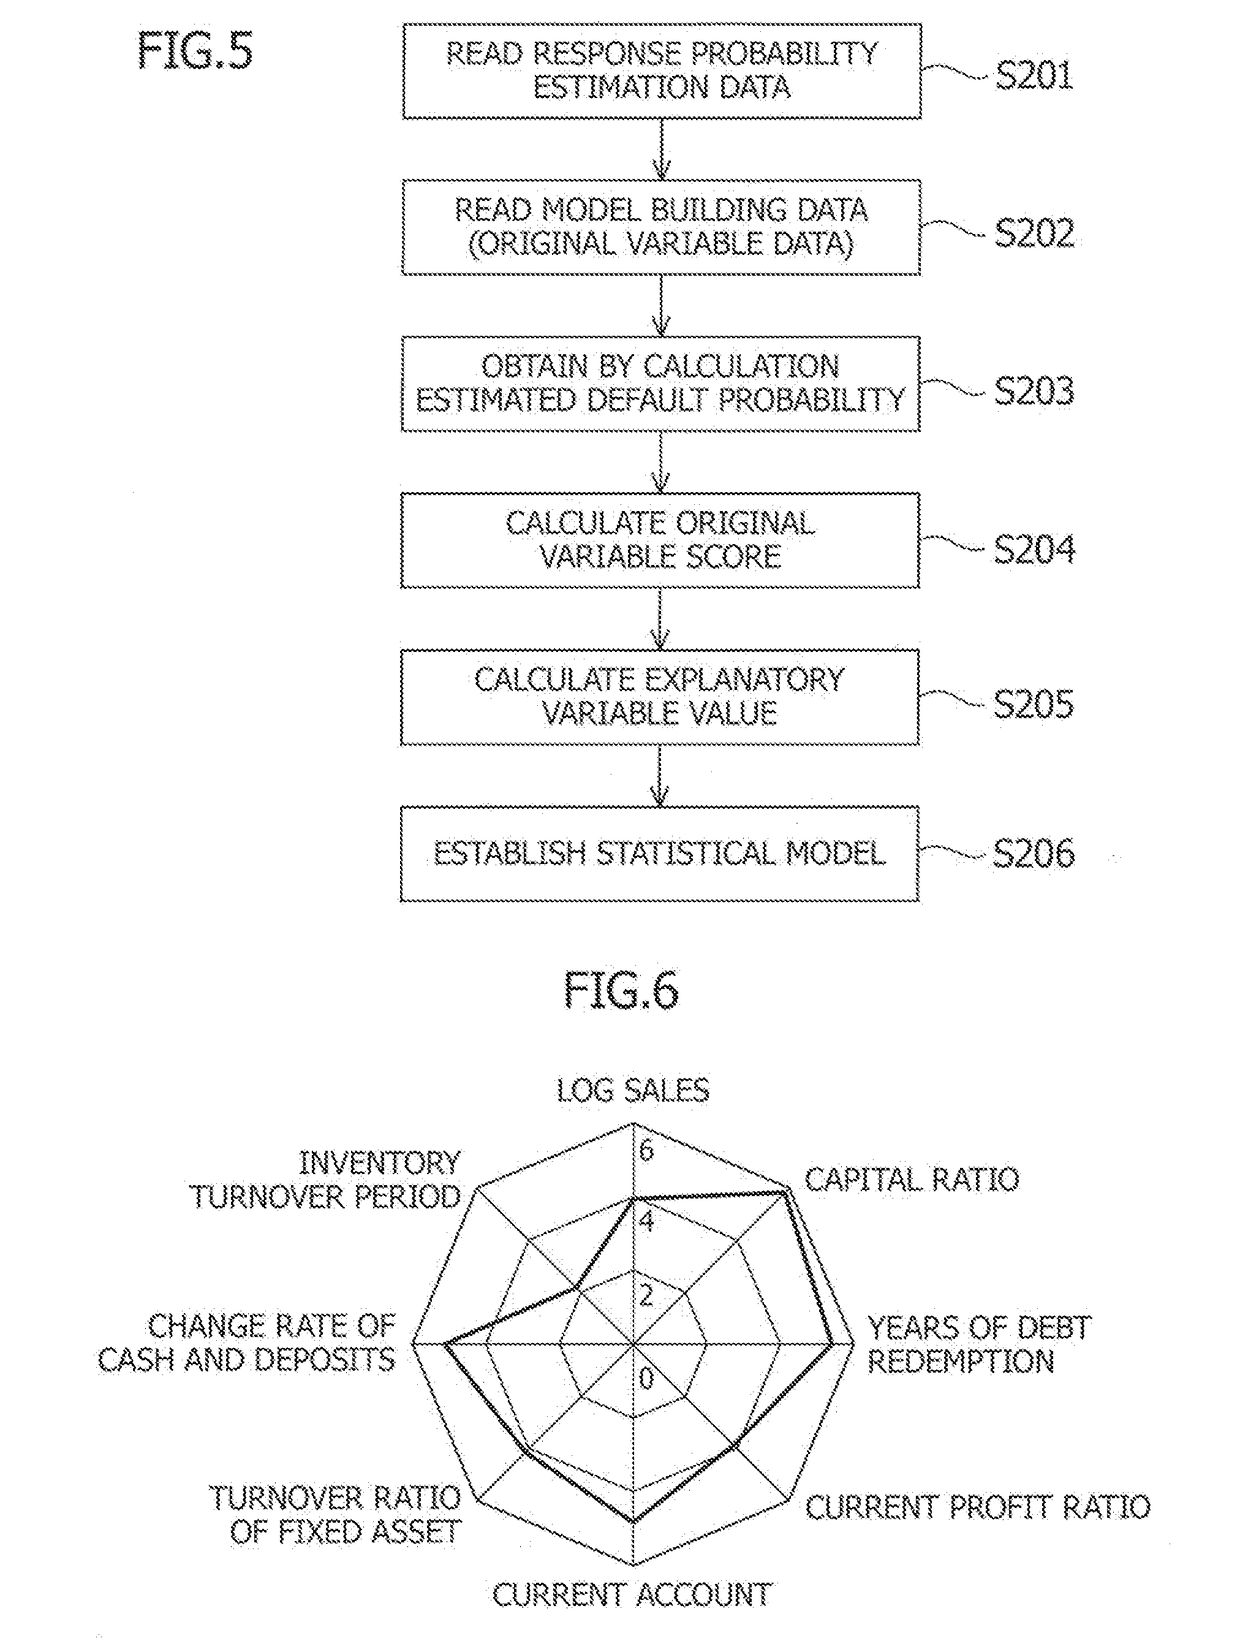
[0024]Many credit evaluating models for businesses use as explanatory variables financial indicators derived from a balance sheet and a profit-and-loss statement. Conceivable examples of the financial indicator include capital ratio, years of debt redemption, a current account, and accounts receivable turnover period.
[0025]In addition, many credit evaluating models for individuals use as explanatory variables indicators of personal attributes. Conceivable examples of such information include age, number of household members, income, and years of employment.
[0026]Information relating to the credit such as business's financial indicators or personal attributes is hereinafter also referred to as “indic...
second embodiment
e Expression
[0073]According to a second embodiment of the present invention, an approximate expression is used, which represents a relationship between an original variable value and an estimated default probability pik, upon obtaining by calculation an estimated default probability pik from the original variable value.
[0074]Various methods are conceivable to build an approximate expression. In this embodiment, segmented linear regression is used. The segmented linear regression is to divide a range of existence of original variable into plural segments and then linearly approximate a relationship between the original variable and its estimated default probability in each segment. The relationship between an original variable value such as a financial indicator and an estimated default probability is complicated. Thus, simple linear regression is more likely to have a very large error. The segmented linear regression is, however, expected to improve approximation precision.
[0075]FIG...
third embodiment
Credit Evaluating Model by Probit Regression
[0087]Probit regression is often used for building a credit evaluating model like logistic regression. According to the probit regression, a relationship between an explanatory variable and a default probability is represented by:
Φ−1(p)=α+β1X1+β2X2+ . . .
where Φ is distribution function of standard normal distribution: Φ corresponds to the function F of the first embodiment. The original variable score can be calculated from Expression 7 using inverse function Φ−1 of the function Φ.
[0088]This embodiment is the same as the first embodiment except the function F.
[0089]Regarding the statistical analysis method for parameter estimation and the distribution function for calculation of indicator score, any particular combination thereof is not necessarily used. For example, the following are also conceivable: an explanatory variable value is calculated using the distribution function of standard normal distribution and a parameter is estimated f...
PUM
 Abstract
Description
Claims
Application Information
 - R&D
- Intellectual Property
- Life Sciences
- Materials
- Tech Scout
- Unparalleled Data Quality
- Higher Quality Content
- 60% Fewer Hallucinations
Browse by: Latest US Patents, China's latest patents, Technical Efficacy Thesaurus, Application Domain, Technology Topic, Popular Technical Reports.
© 2025 PatSnap. All rights reserved.Legal|Privacy policy|Modern Slavery Act Transparency Statement|Sitemap|About US| Contact US: help@patsnap.com


