Temperature independent pressure sensor and associated methods thereof
a temperature-dependent, sensor technology, applied in fluid pressure measurement using inductance variation, instruments, machines/engines, etc., can solve problems such as signal artifacts
- Summary
- Abstract
- Description
- Claims
- Application Information
AI Technical Summary
Benefits of technology
Problems solved by technology
Method used
Image
Examples
example 1
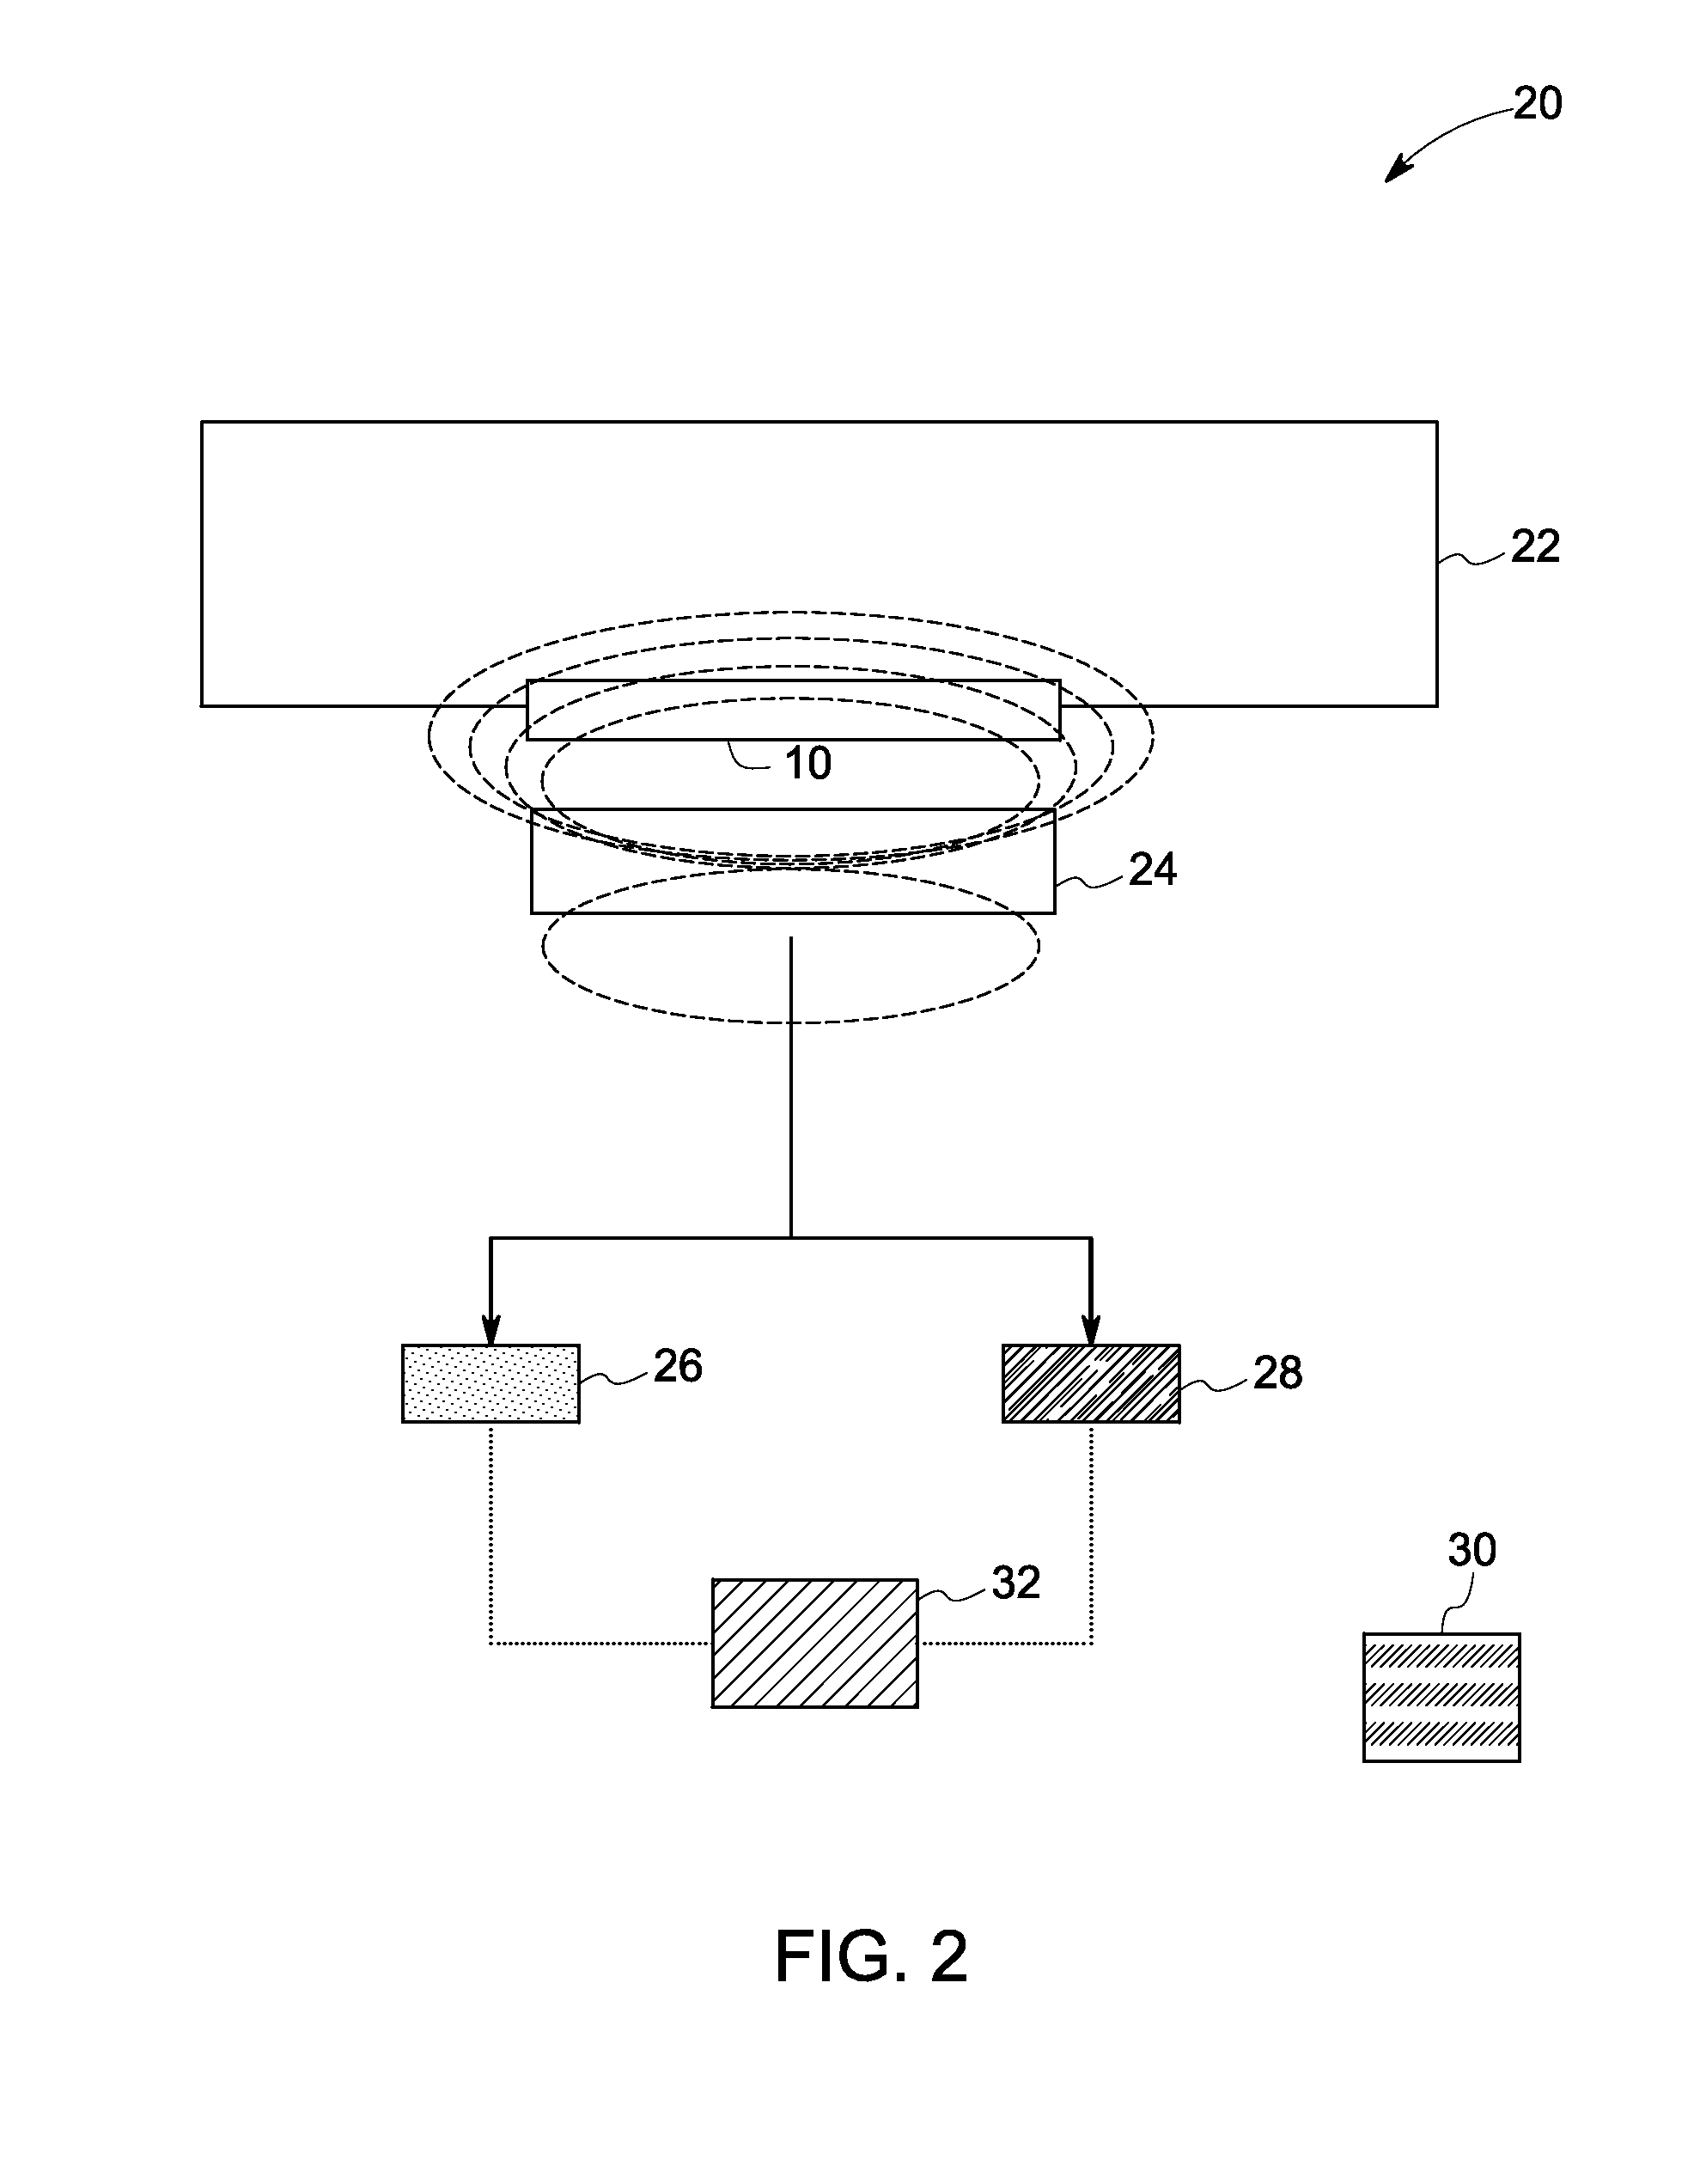
[0065]Measurements of the complex impedance of RFID pressure sensors were performed with a network analyzer (Model E5062A, Agilent Technologies, Inc. Santa Clara, Calif.) under computer control using Lab VIEW. The network analyzer was used to scan the frequencies over the range of interest (typically centered at ˜13 MHz with a scan range of ˜10 MHz) and to collect the complex impedance response from the RFID pressure sensor. The collected complex impedance data was analyzed using Excel (MicroSoft Inc. Seattle, Wash.) or KaleidaGraph (Synergy Software, Reading, Pa.) and PLS_Toolbox (Eigenvector Research, Inc., Manson, Wash.) operated with Matlab (The Mathworks Inc., Natick, Mass.).
[0066]For quantitation of pressure with a single sensor over a varied temperature range, a temperature range of 10° C.-60° C. was selected. The pressure was quantitated using multivariate analysis of data acquired from RFID based sensor. A 9 mm Tag Sys RFID tag was adapted for sensing of pressure by attachi...
example 2
[0068]A similar experiment was performed in which the sensor was subjected to four different pressures (0 psi, 7 psi, 16 psi, and 24 psi) over the temperatures of about 10° C., 33° C., and 57° C. FIG. 6A shows a multivariate response of the sensor, using principal component analysis (PCA) where the sensor was subjected to four different pressures, such as, 0 psi, 7 psi, 16 psi, and 24 psi and three temperatures of 10° C., 33° C., and 57° C. The PCA plot of the first two principal components was related to the simultaneous changes in the pressure and the temperature of the fluid. Using these two principal components as inputs, FIG. 6B shows the plot for a sensor response pattern generated by measuring actual pressure vs. predicted pressure, and FIG. 6C shows the error distribution generated using the sensor by measuring actual pressure vs. the residual for the temperature independent model. As a result, the pressure sensor was able to quantify pressure at different temperatures of th...
PUM
| Property | Measurement | Unit |
|---|---|---|
| frequency | aaaaa | aaaaa |
| frequencies | aaaaa | aaaaa |
| pressure | aaaaa | aaaaa |
Abstract
Description
Claims
Application Information
 - R&D
- Intellectual Property
- Life Sciences
- Materials
- Tech Scout
- Unparalleled Data Quality
- Higher Quality Content
- 60% Fewer Hallucinations
Browse by: Latest US Patents, China's latest patents, Technical Efficacy Thesaurus, Application Domain, Technology Topic, Popular Technical Reports.
© 2025 PatSnap. All rights reserved.Legal|Privacy policy|Modern Slavery Act Transparency Statement|Sitemap|About US| Contact US: help@patsnap.com


