Method of determining a seismic velocity profile
a velocity profile and seismic technology, applied in the field of method of determining a seismic velocity profile, can solve the problems of difficult to relate arrival time to velocity, erroneous velocity profiles, and difficulty in extraction of velocity profiles from check shots
- Summary
- Abstract
- Description
- Claims
- Application Information
AI Technical Summary
Benefits of technology
Problems solved by technology
Method used
Image
Examples
example 1
P-Wave Virtual Checkshot
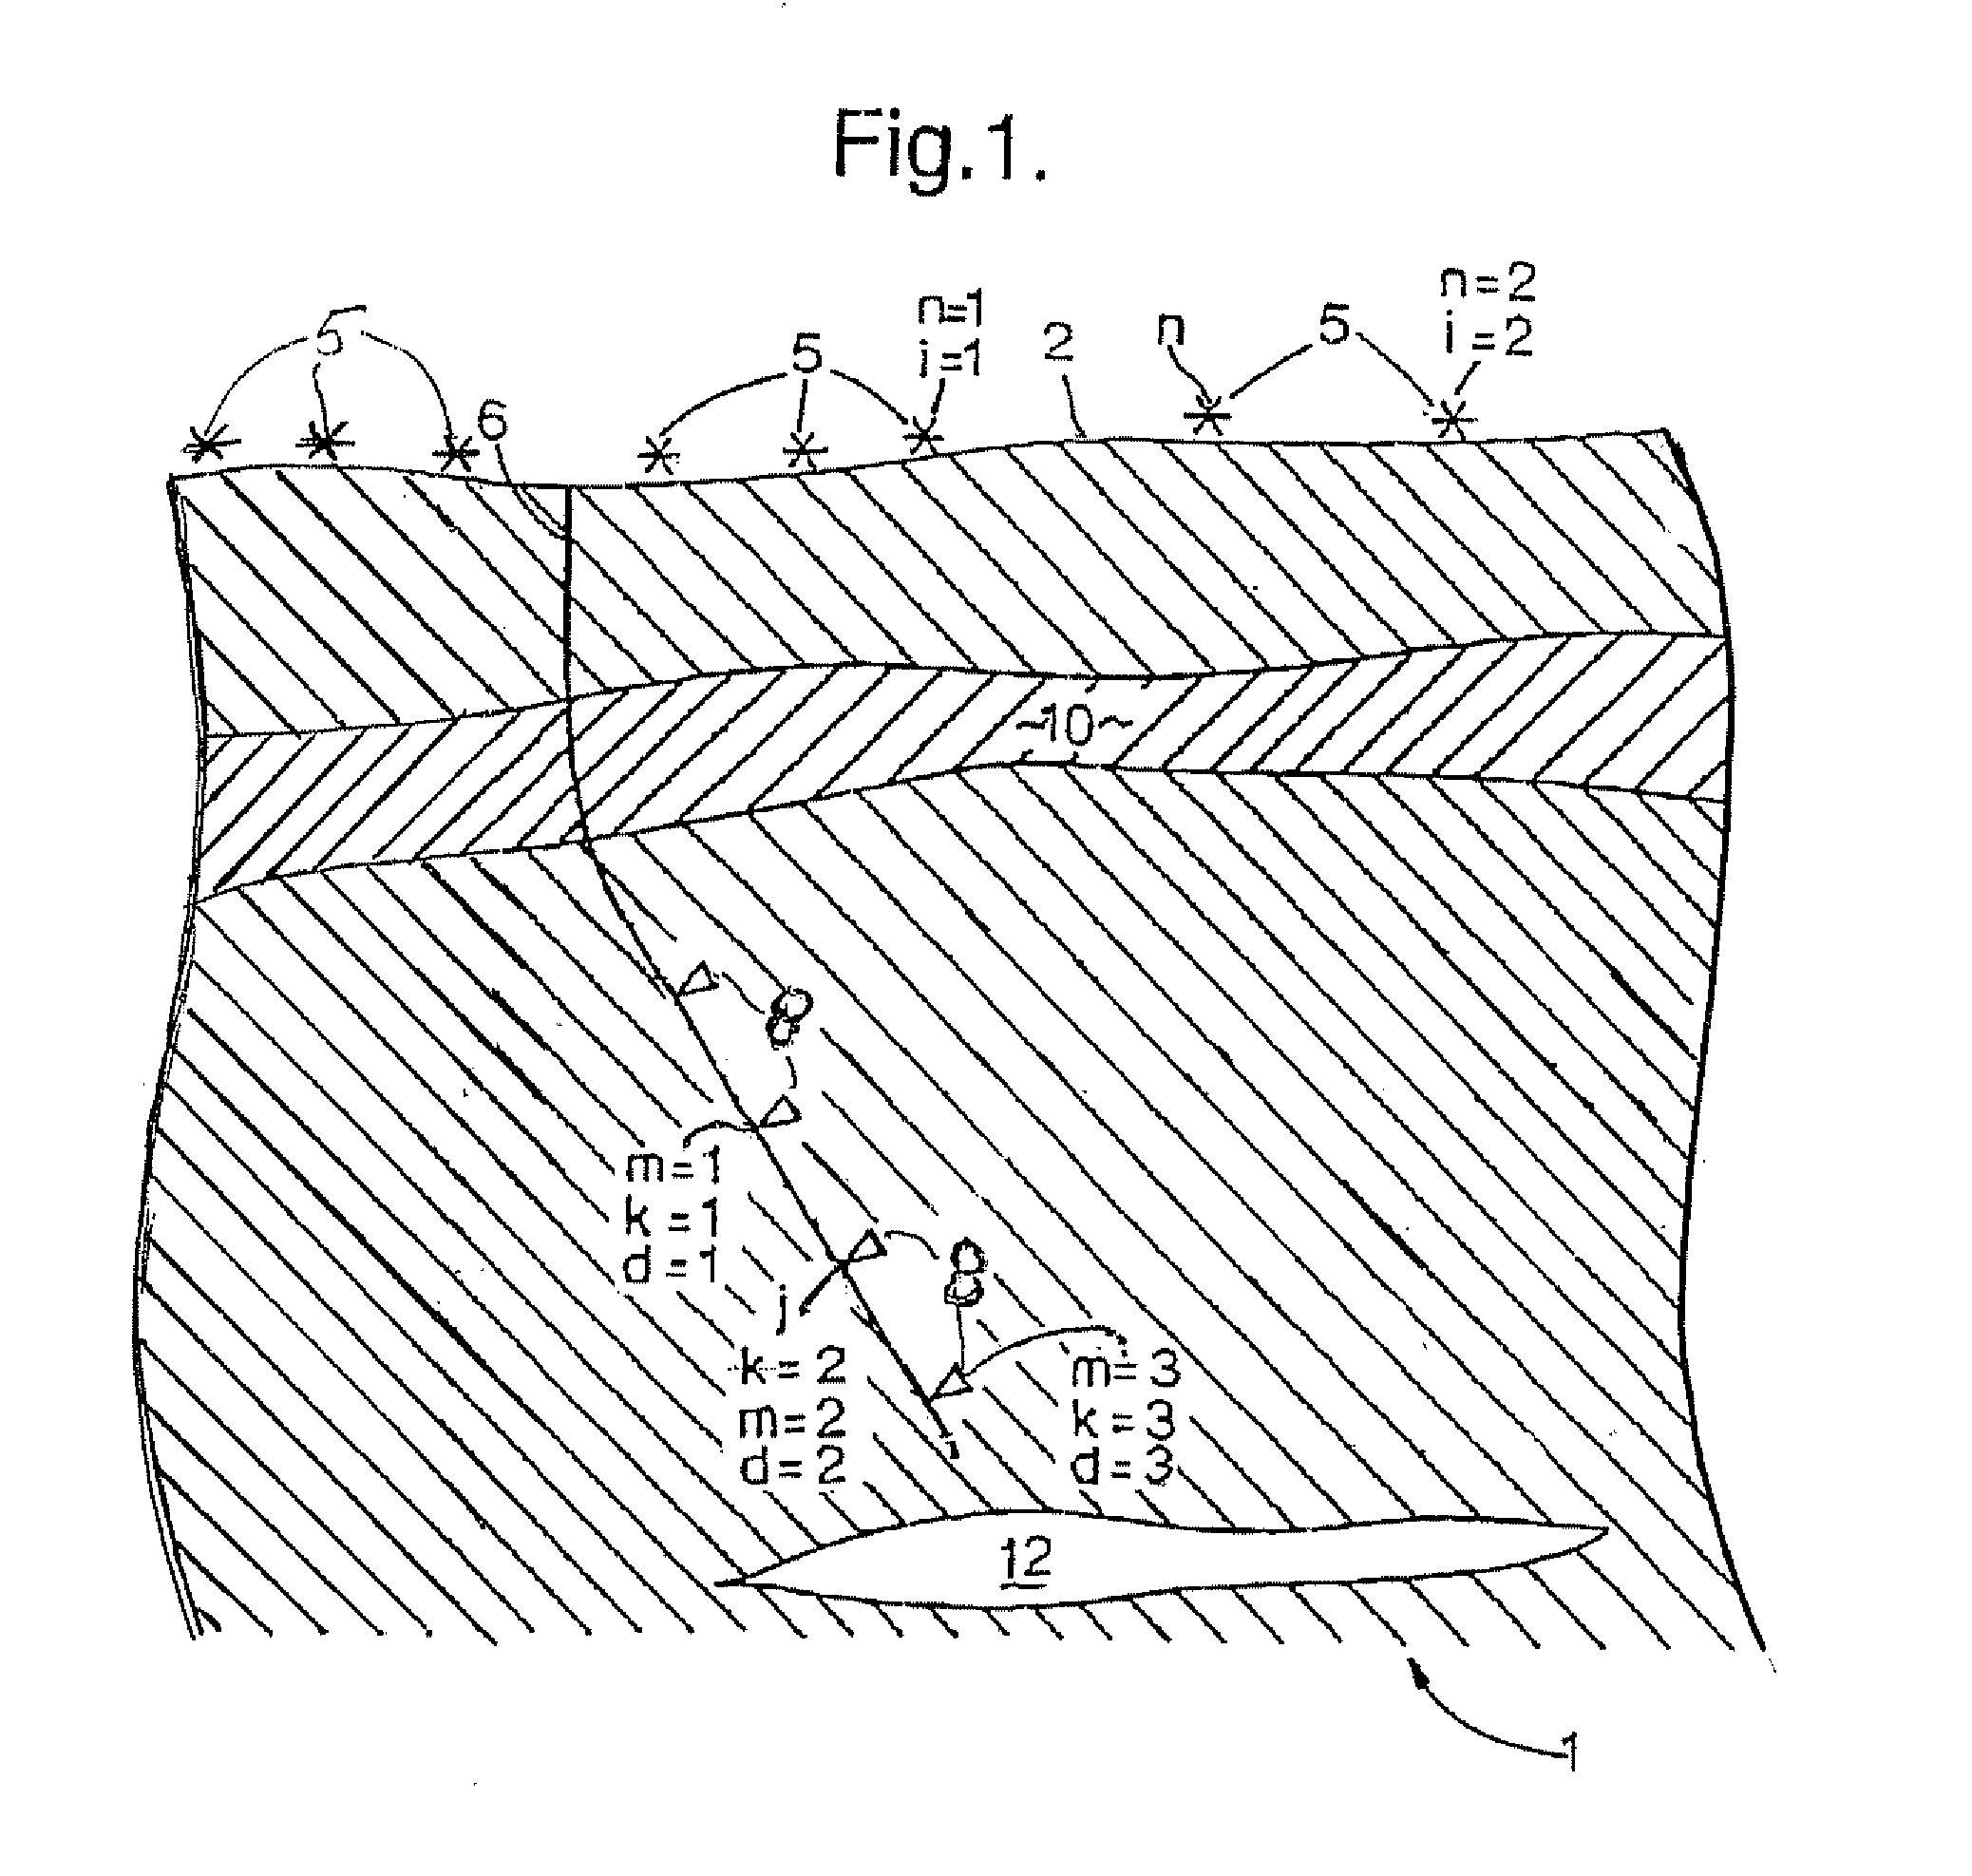
[0073] To create the P-wave virtual source, the present example uses as input the vertical (Z) component of the VSP data. A virtual source was created at every receiver depth. A common virtual shot gather with a P-wave virtual source (PVS) located at the top-most receiver location is shown in FIG. 3(a). FIG. 3(a) thus shows the virtual signal traces uvsmk(t) for m=1 and various k ranging from 2 to 96. The gaps at traces k=12-13 and k=60-61 are caused by dead receivers.
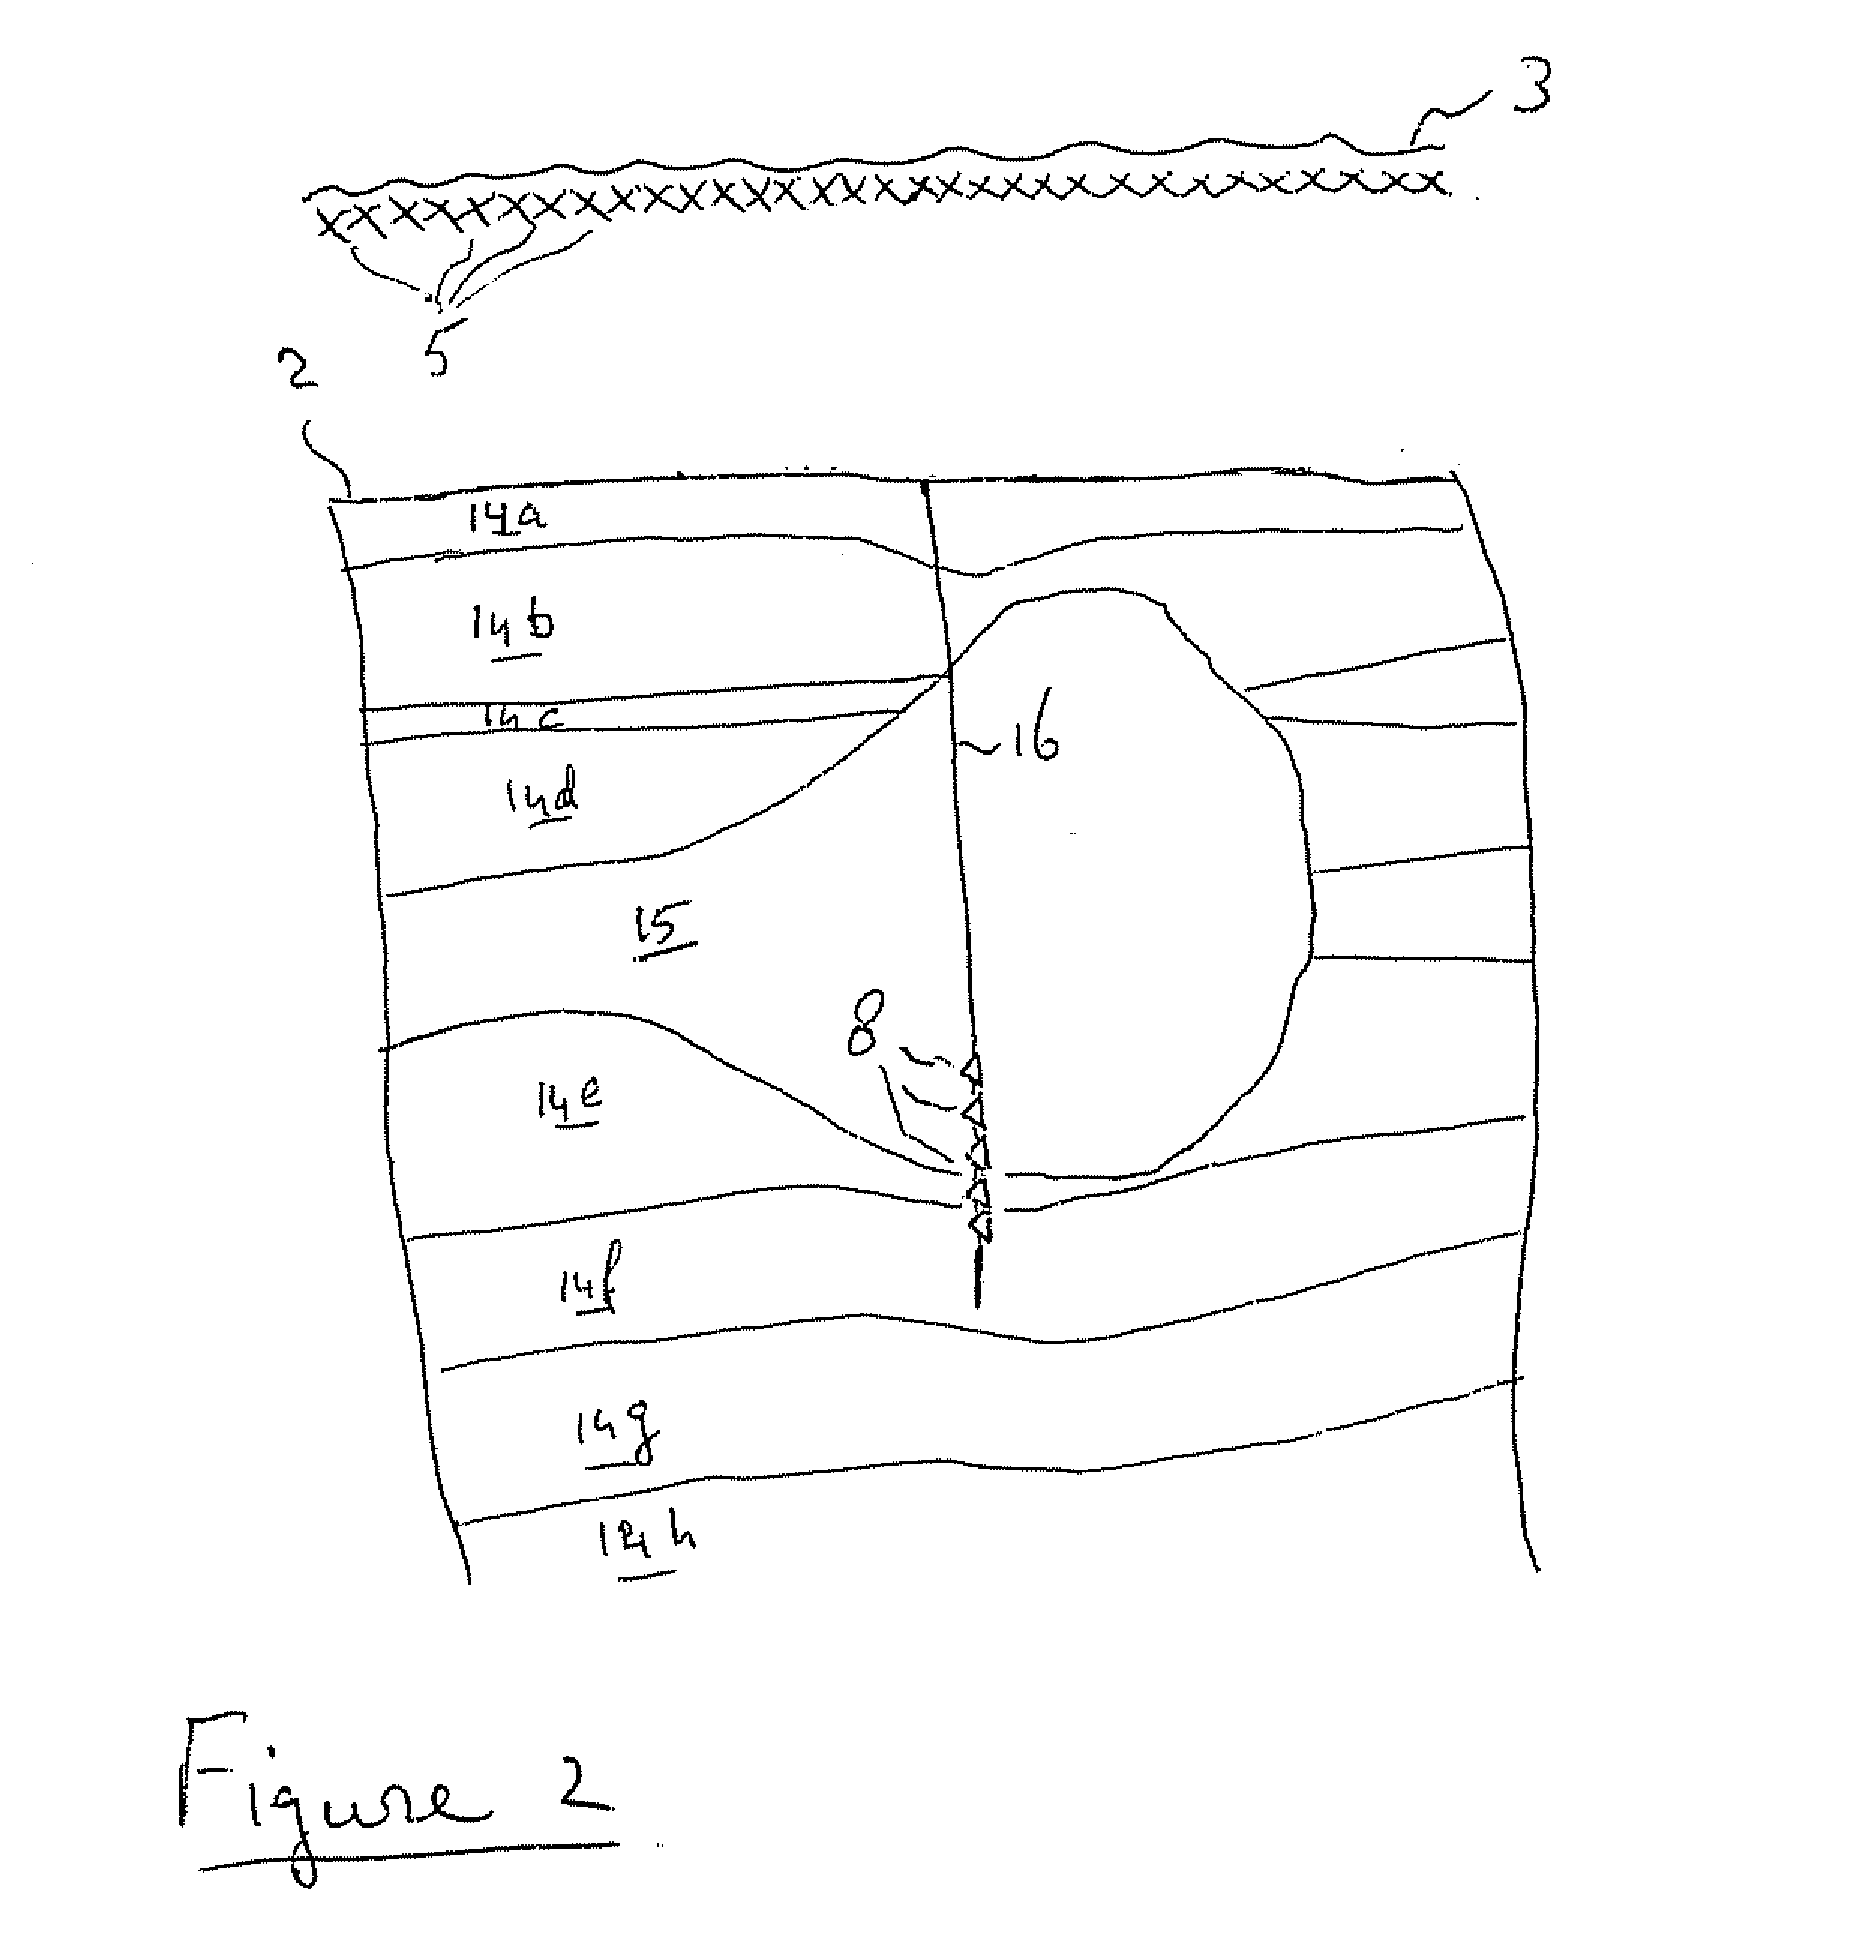
[0074] The virtual source “fires” a zero-phase impulse at time t=100 ms. The first arrival on the virtual signal traces is clear and easy to pick. Only picks on receivers from the same tool setting [30 m (exactly 100 ft) apart] were used for interval velocity estimation. A linear fit to the first arrival moveout provides the following P-wave velocity estimate in the region of interest: Vp≈2.82 km / s (9400 ft / s). The region of interest in the example is below the salt body 15.
[0075]FIG. 4 plots...
example 2
S-Wave Virtual Checkshot
[0077] The present example VSP data set was acquired with airguns in the water—they do not directly excite shear waves. Nevertheless, a shear virtual source can be created by harvesting P-S conversions that may occur at heterogeneities above the seismic receivers. Further details may be found in a paper presented by A. Bakulin and R. Calvert at the 2005 Annual International Meeting of the Society of Exploration Geophysicists in Houston, entitled “Virtual shear source: a new method for shear-wave seismic surveys”, and published in Expanded Abstracts pages 2633-2636, herein incorporated by reference in its entirety. The strongest P-S conversion is thought to occur at the top of salt. We verified this by ray-tracing.
[0078] There is, however, no need to know where in the overburden the conversions occurred. They may occur at many places at once and be very complicated. The present VS method collapses them all to a useful virtual shear signal radiated from the s...
example 3
Velocity Estimation in a Salt Body
[0081] Since virtual check shots measure interval velocities, our primary focus was on the sediments below the salt rather than on the relatively homogeneous salt. But for the sake of completeness, it is remarked that the virtual check shots may also be used to measure the average P- and S-wave velocities in salt. In the present example, the average velocities were estimated, as opposed to a detailed velocity profile in salt, mainly because it is a common practice to assign a single velocity value to salt bodies for seismic processing. Also, since the salt is much faster than sediments, interval velocities (average over 30 m) would have much larger uncertainties than interval velocities below salt.
[0082] A linear regression through the virtual source first arrivals in salt gave Vp=4.398±0.099 km / s (14660±330 ft / s) and Vs=2.52±0.11 km / s (8390±350 ft / s), corresponding to Vp / Vs=1.75±0.08. Smoothed logs over the same depth interval of 480 m (1600 ft) ...
PUM
 Abstract
Description
Claims
Application Information
 - R&D
- Intellectual Property
- Life Sciences
- Materials
- Tech Scout
- Unparalleled Data Quality
- Higher Quality Content
- 60% Fewer Hallucinations
Browse by: Latest US Patents, China's latest patents, Technical Efficacy Thesaurus, Application Domain, Technology Topic, Popular Technical Reports.
© 2025 PatSnap. All rights reserved.Legal|Privacy policy|Modern Slavery Act Transparency Statement|Sitemap|About US| Contact US: help@patsnap.com


