
System for visualizing functions that depend on multiple parameters

a technology of visualizing functions and parameters, applied in the field of system for visualizing functions that depend on multiple parameters, can solve problems such as difficulty in understanding the behavior of the system, requiring a level of programming expertise that is not available to many would-be system users, and presenting significant challenges to anyone attempting to use the system

Active Publication Date: 2021-04-27
KEYSIGHT TECH
View PDF10 Cites 0 Cited by
  • Summary
  • Abstract
  • Description
  • Claims
  • Application Information

AI Technical Summary

Benefits of technology

The patent text is about a method where a data processing system can provide values for certain parameters that are not specified as either rows or columns. This can be useful when you need to make certain calculations or adjustments based on the data, but don't know which specific parameters to set.

Problems solved by technology

These functions are often either non-linear or their parameters are not independent, and hence, understanding the behavior of the system as these parameters are changed presents significant challenges for anyone attempting to use the system.
However, this solution requires a level of programming expertise that is not available to many would be system users.
Furthermore, the types of graphs that are useful for one problem are not optimum for other problems.
Again, constructing these multi-graph displays presents significant programming challenges.

Method used


Image

  • System for visualizing functions that depend on multiple parameters
  • System for visualizing functions that depend on multiple parameters
  • System for visualizing functions that depend on multiple parameters

Examples


Embodiment Construction

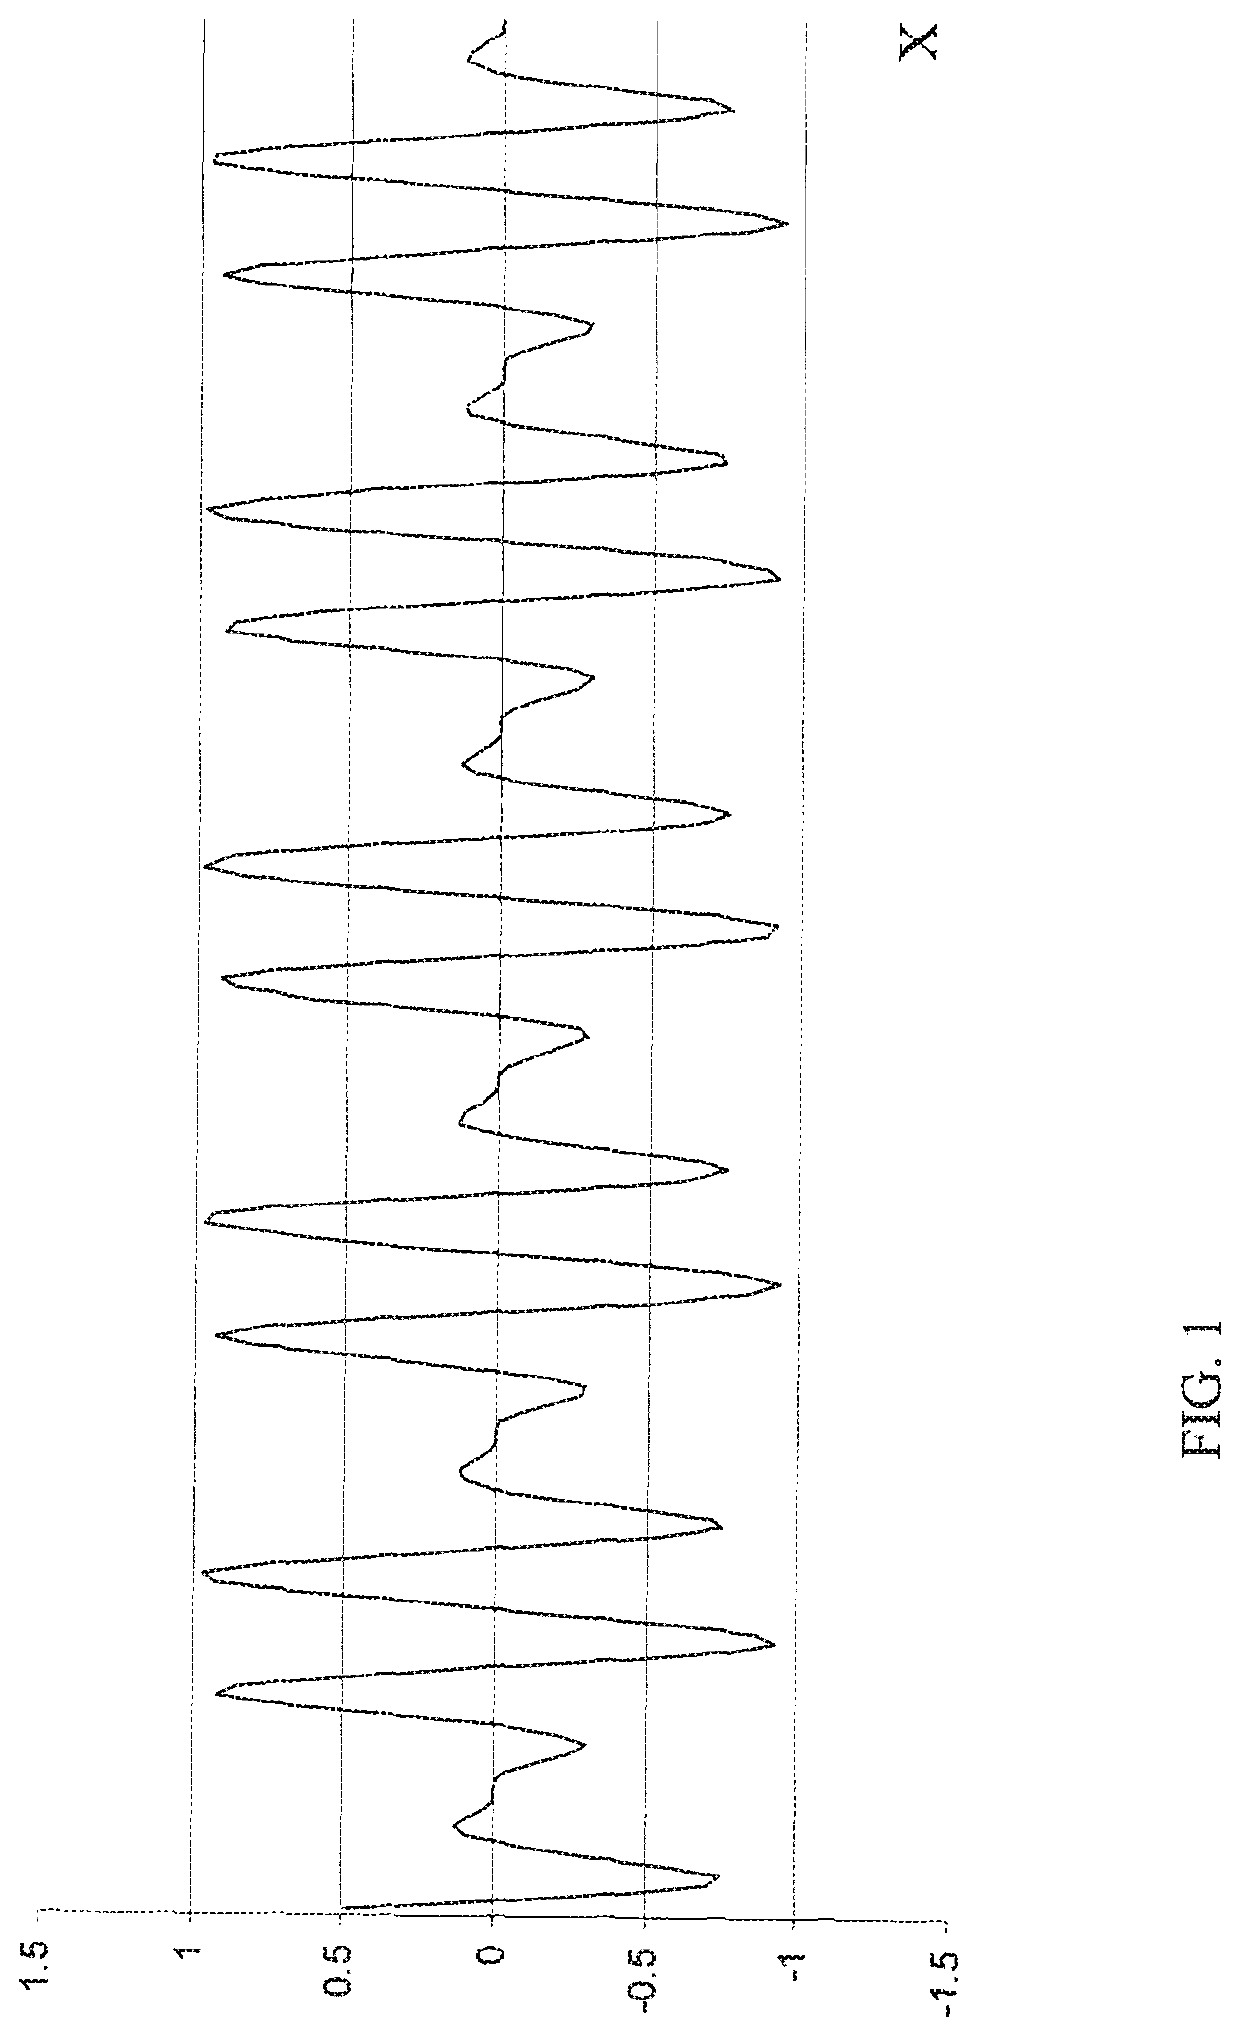
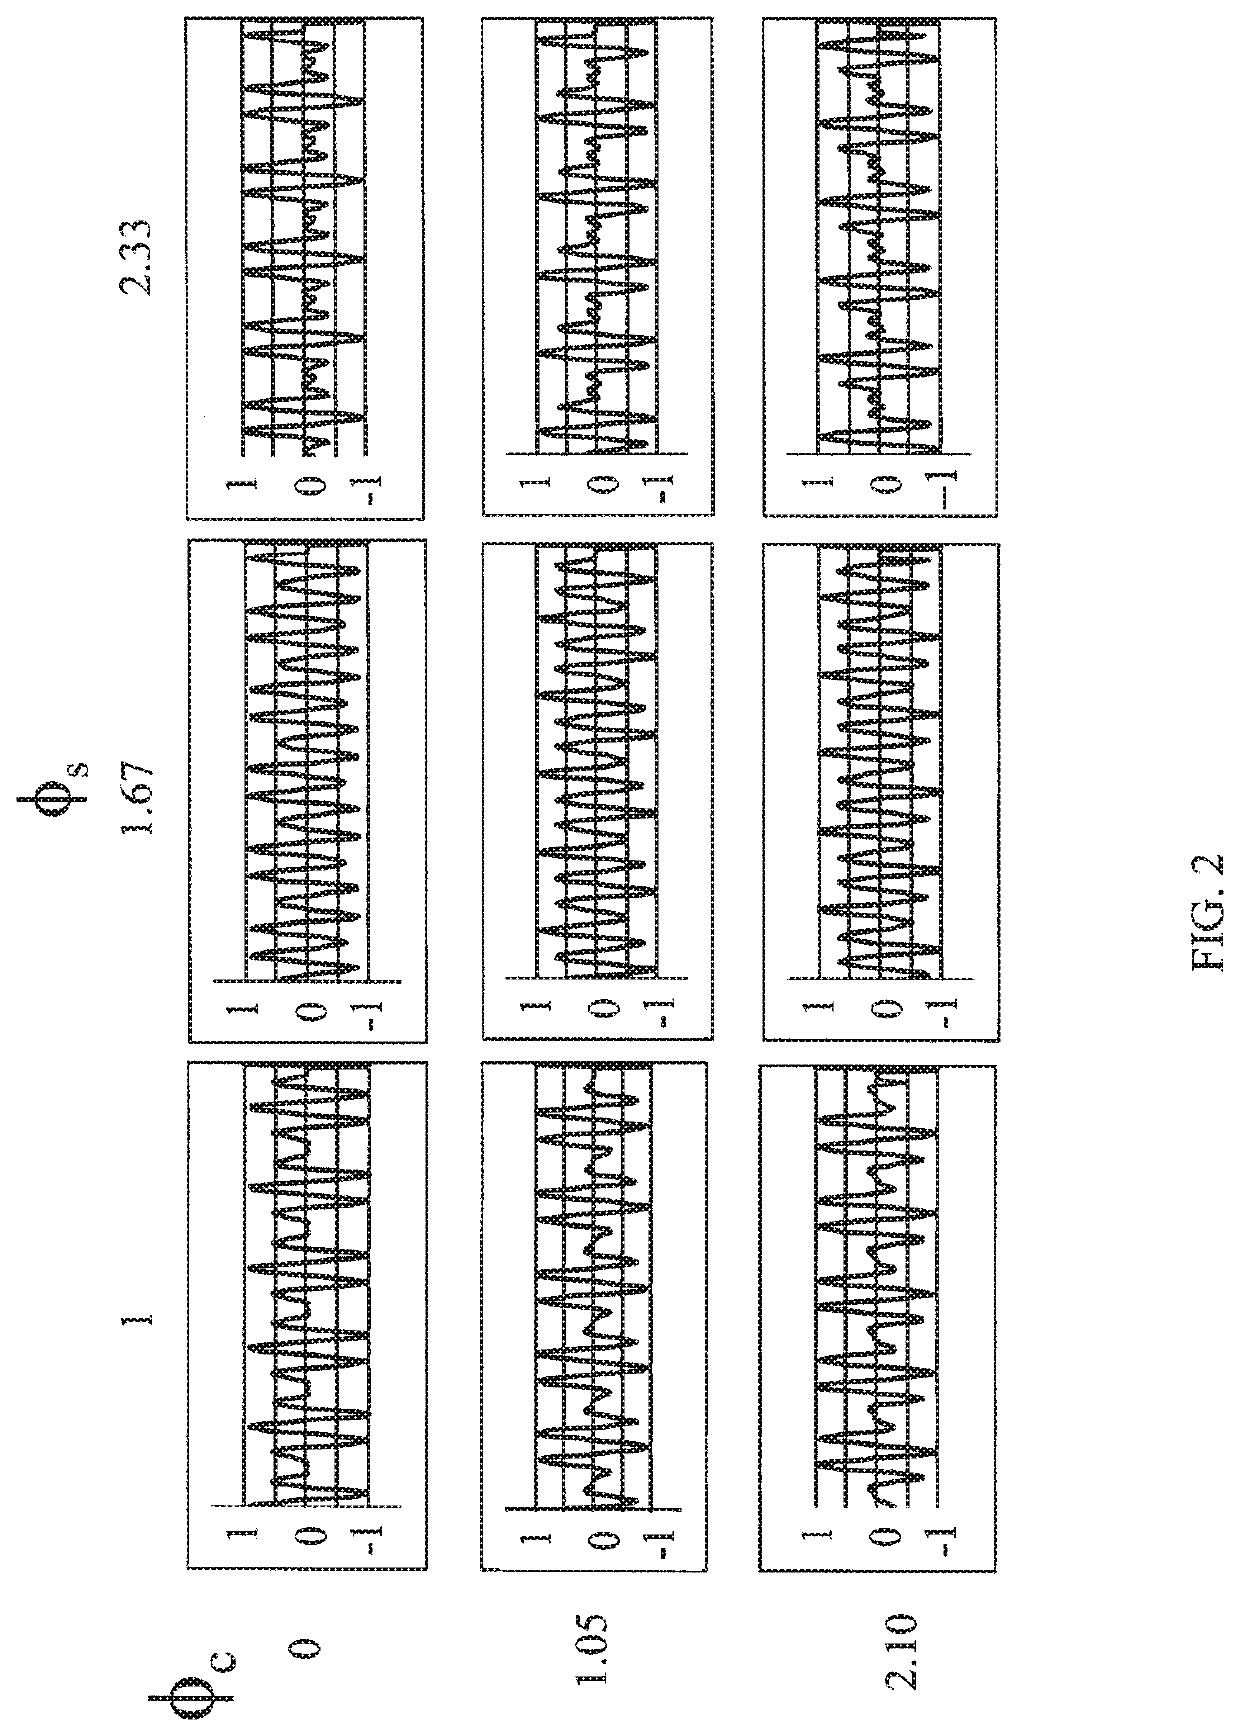
[0026]Even relatively simple functions can depend on a number of parameters. Exploring the behavior of such a function often involves setting some of the parameters to constants and then varying one or more of the other parameters, referred to as “variable parameters” in the following discussion, to generate graphs that allow the user to obtain a “feel” for the manner in which the function changes when the variable parameters change.

[0027]Consider the case in which a user wants to get a “feel” for the manner in which a function f(a1, a2 . . . aN, x) depends on the parameters ai. One method for obtaining that information would be to graph the function of x for exemplary values of the ai. There are numerous computer programs that will provide a graph of f( ) for specified values of the ai. All of these programs require some programming expertise on the part of the user. For example, a spreadsheet program will graph an array of values. However, the user must program a spreadsheet to cr...


PUM


Abstract

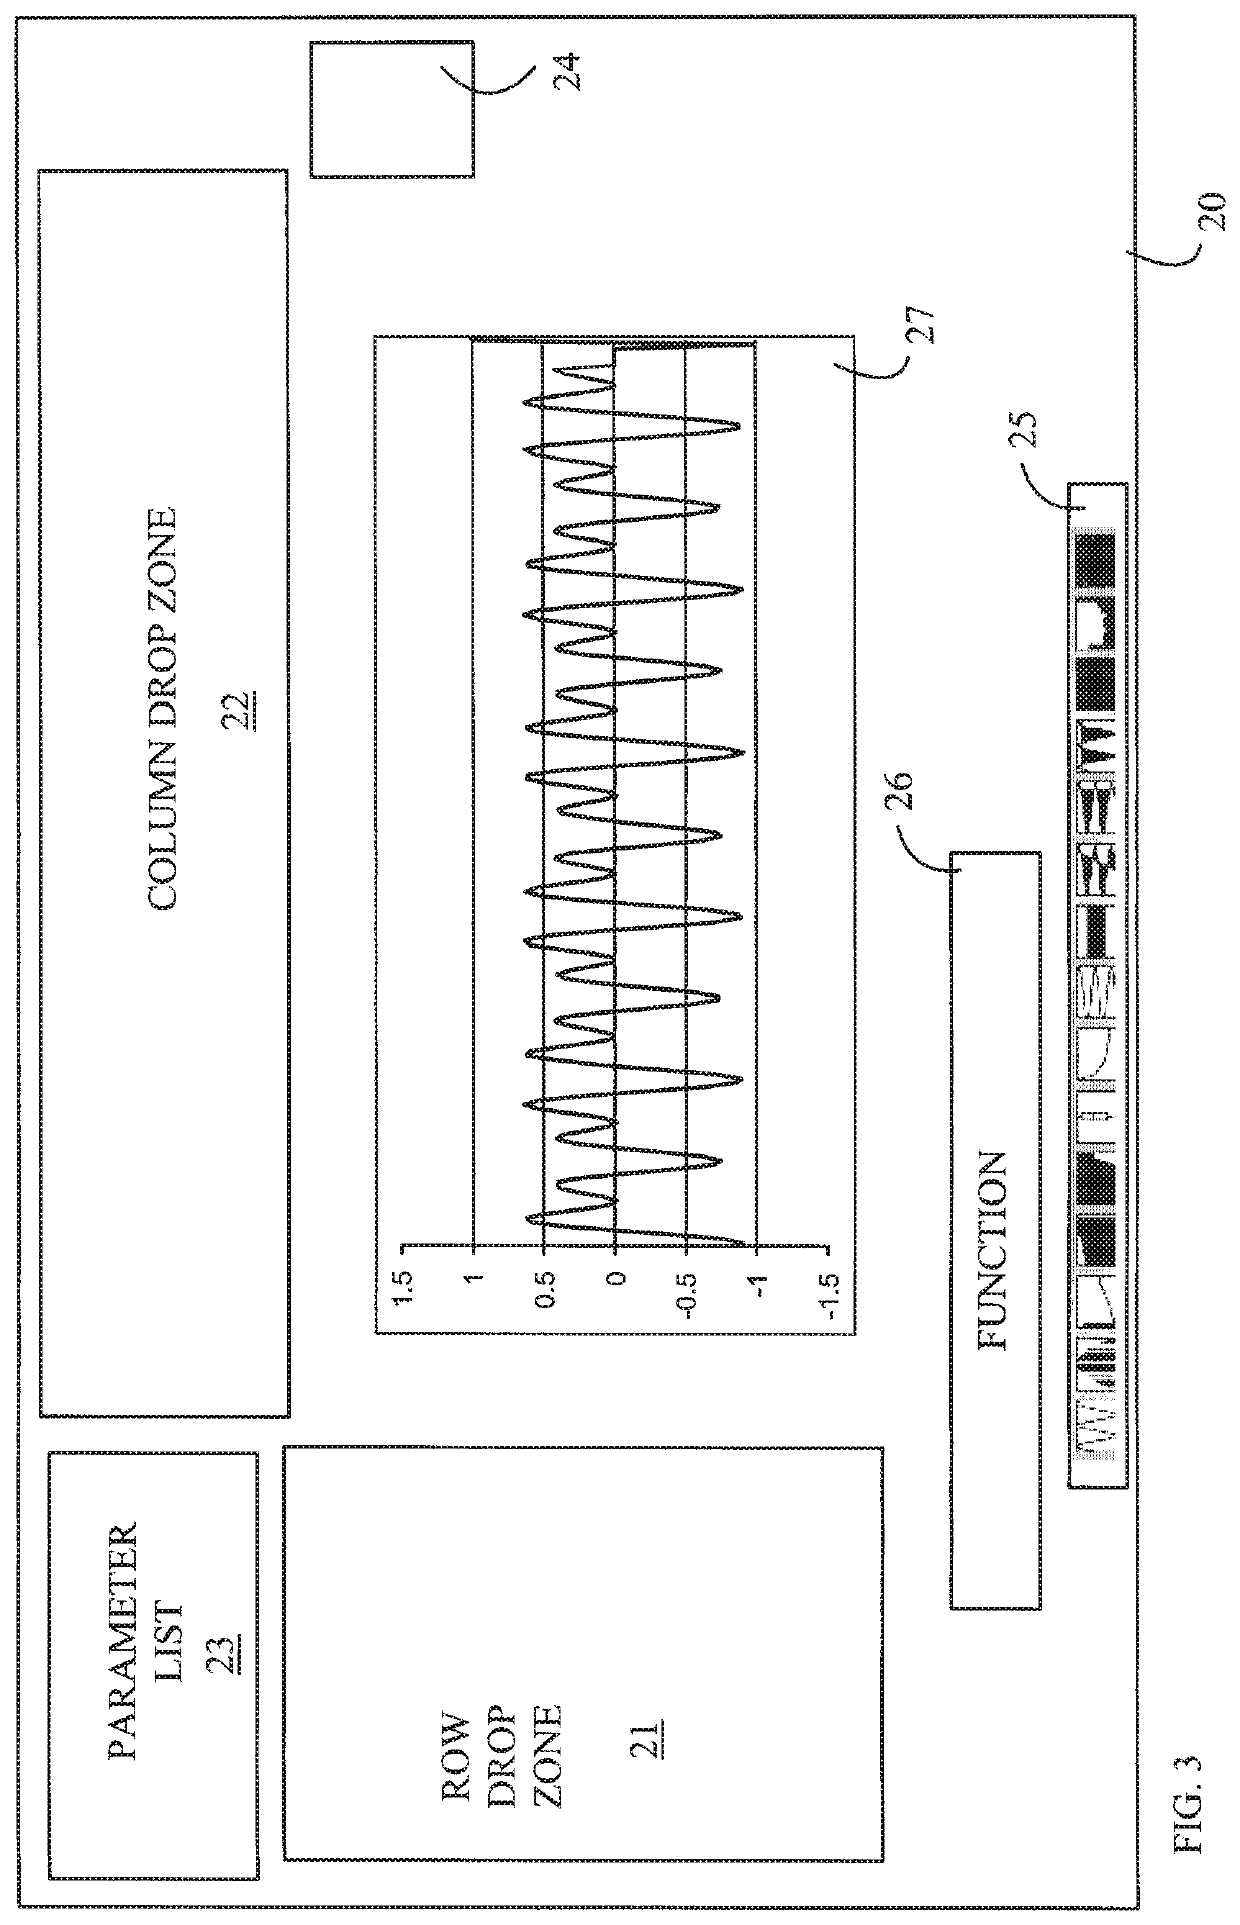
A method for operating a data processing system to provide a graphic visualization of a function is disclosed. The method includes causing the data processing system to present a first GUI to a user on a display associated with the data processing system, causing the data processing system to receive a text string that defines the function in terms of variable parameters and elementary functions, causing the data processing system to provide a list of the variable parameters, receiving user input specifying row and column parameters selected from the list of variable parameters, and generating a grid plot of the function on the display.

Description

BACKGROUND OF THE INVENTION[0001]Many systems of interest, whether physical or virtual, are described by functions that depend on two or more parameters. These functions are often either non-linear or their parameters are not independent, and hence, understanding the behavior of the system as these parameters are changed presents significant challenges for anyone attempting to use the system. In principle, the user could program a computer to graph the function in question for any particular choice of the parameters and explore the behavior of the function as the user changes various parameters. However, this solution requires a level of programming expertise that is not available to many would be system users. Furthermore, the types of graphs that are useful for one problem are not optimum for other problems. Finally, multiple graphs may be required to understand the system. These graphs may evaluate different related functions that also depend on the parameters in question. Again,...

Claims


Application Information

Patent Timeline
IPC IPC(8): G06T11/20G06F3/0484G06F3/0482
CPCG06T11/206G06F3/0482G06F3/0484G06T11/203G06T2200/24
Inventor HELFMAN, JONATHAN
Owner KEYSIGHT TECH
Learn More