Method for compensating modal dispersion in multimode optical fiber transmission path
A multi-mode fiber, modal dispersion technology, applied in the direction of optical waveguide light guide, etc., can solve the problems of complex calculation, difficulty, long time and so on
- Summary
- Abstract
- Description
- Claims
- Application Information
AI Technical Summary
Problems solved by technology
Method used
Image
Examples
specific example 2-1
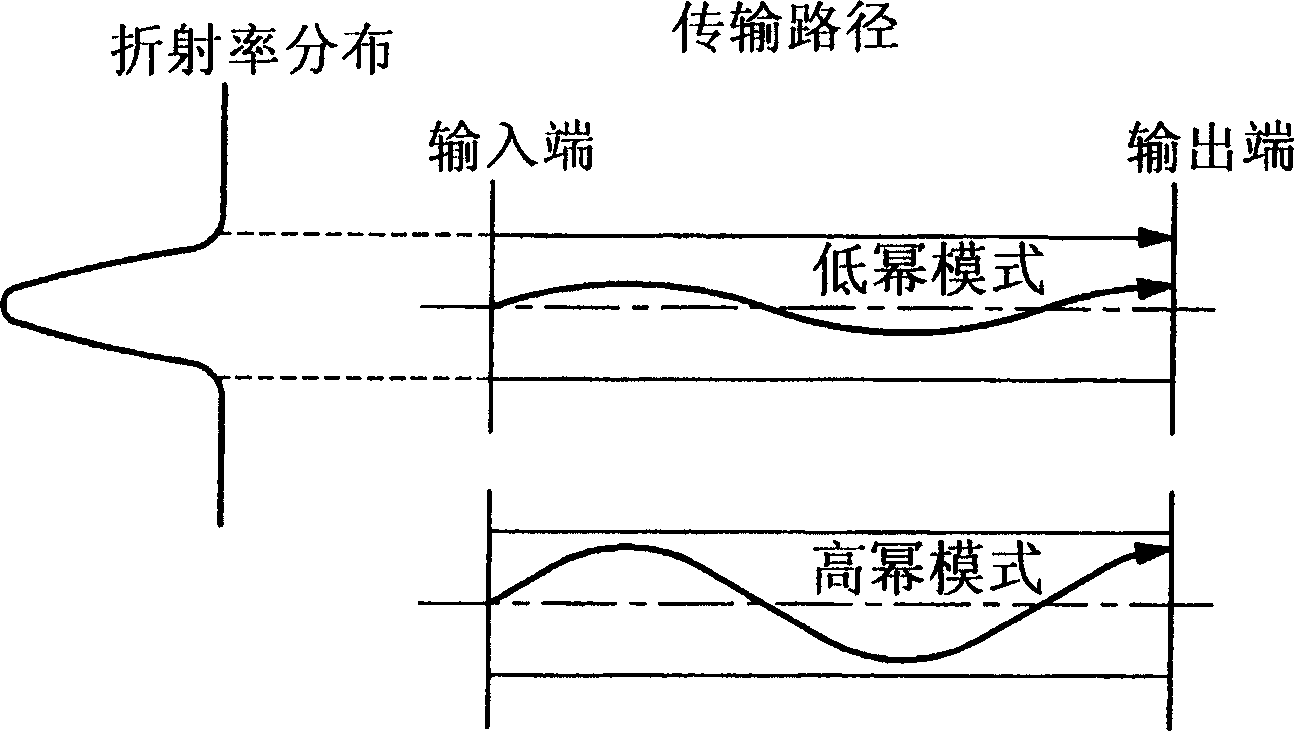
[0232] Figure 31 The refractive index distributions of the optical fiber to be compensated and the modal dispersion compensating optical fiber in Specific Example 2-1, and the refractive index distribution that can obtain the maximum frequency band in the wavelength of the signal light used are shown.
[0233] The fiber to be compensated is the refractive index n at a distance r from the center of its core target (r) is formed by approximate calculation using the following formula (9).
[0234] Among them, n(r) represents the refractive index at a distance r from the center of the fiber core, n 1Indicates the refractive index at the center of the fiber core, Δ 1 Indicates the specific refractive index difference between the center of the core and the cladding, a indicates the radius of the core, and α indicates the power of the refractive index distribution.
[0235] n ( r ) = ...
specific example 2-2
[0264] Using the optical fiber to be compensated and the modal dispersion compensating optical fiber having the refractive index distribution powers shown in Table 2, an optical transmission line was formed in the same manner as in Specific Example 2-1. When the wavelength of the signal light is 0.85 μm, the refractive index distribution power α of the refractive index distribution in the maximum frequency band can be obtained opt is 2.04.
[0265]
specific example
the wavelength of
(μm)
Compensated fiber
distribution power
alpha target
Compensation fiber fold
Emissivity distribution constant
number k
length of compensating fiber
L comp (km)
2-2
0.85
1.90
2
0.162
2-3
0.85
2.00
10
0.11
2-4
0.85
2.03
20
...
specific example 2-3
[0272] Figure 37 The frequency band of the OFL of the optical transmission line using the compensated optical fiber in Example 2-3 is calculated by simulation, and the length L of the optical fiber is compensated by the modal dispersion comp to draw the graph. The difference from the specific example 2-1 is that the refractive index distribution power of the compensated fiber α target is 2.00.
[0273] It can be seen that despite the expression Δ comp (r) The larger the constant k in the formula (8), the smaller the maximum value of the frequency band tends to be. However, when the constant k is 10 or less, the maximum value of the frequency band does not tend to decrease significantly, but remains almost constant.
[0274] Therefore, in the case of compensating the modal dispersion of the compensated optical fiber in specific example 2-3, Δ with constant k of 10 in formula (8) is adopted comp For the modal dispersion compensating fiber of (r), the length L of the modal d...
PUM
| Property | Measurement | Unit |
|---|---|---|
| Center wavelength | aaaaa | aaaaa |
| Wavelength | aaaaa | aaaaa |
| Wavelength | aaaaa | aaaaa |
Abstract
Description
Claims
Application Information
 - Generate Ideas
- Intellectual Property
- Life Sciences
- Materials
- Tech Scout
- Unparalleled Data Quality
- Higher Quality Content
- 60% Fewer Hallucinations
Browse by: Latest US Patents, China's latest patents, Technical Efficacy Thesaurus, Application Domain, Technology Topic, Popular Technical Reports.
© 2025 PatSnap. All rights reserved.Legal|Privacy policy|Modern Slavery Act Transparency Statement|Sitemap|About US| Contact US: help@patsnap.com


