
Traffic jam tracing method based on multi-source data

A technology of traffic congestion and multi-source data, which is applied in the traffic control system of road vehicles, traffic flow detection, traffic control system, etc., can solve the problems of position deviation, insufficient matching accuracy, insufficient data sample size, etc., and achieve a large sample size , high precision effect

Active Publication Date: 2021-11-30
SOUTHEAST UNIV
View PDF0 Cites 2 Cited by
  • Summary
  • Abstract
  • Description
  • Claims
  • Application Information

AI Technical Summary

Problems solved by technology

These algorithms all show the problem of insufficient matching accuracy when facing sparse AVI data
[0005] Problems existing in the existing technology: On the one hand, the existing traffic congestion traceability methods mostly use GPS data, but there are limitations such as insufficient data sample size and location deviation, and it is impossible to realize traffic congestion traceability based on large-scale samples
On the other hand, although a quasi-full sample of traffic congestion can be traced by matching massive AVI trajectory data to the traffic network, there is a lack of map matching algorithms for sparse AVI data.

Method used


Image

  • Traffic jam tracing method based on multi-source data
  • Traffic jam tracing method based on multi-source data
  • Traffic jam tracing method based on multi-source data

Examples


Embodiment 1

[0147] (1) Data collection and extraction

[0148] Road network: In the experiment, the road network in Shenzhen, China, with a total length of 21,985 kilometers was used. The city-wide network map covers a spatial extent of 40 × 50 km and contains 237,440 nodes and 215,771 road connections.

[0149] AVI dataset: 715 AVI datasets detected by fixed sensors were collected in Shenzhen from September 1st to October 31st, 2016. The locations of these fixed sensors are as Figure 9 Shown by dots in . The distribution histograms of temporal and spatial gaps of AVI observation pairs were calculated, respectively as Figure 10 with Figure 11 shown. The mean, median and variance of the time gap are 12.18min, 5.54min and 252.83min, respectively 2 , the corresponding statistical data of the spatial intervals are 16.25 km, 10.23 km and 292.93 km respectively 2 . The statistical indicators of AVI data are shown in Table 1. The time and space intervals of AVI data are beyond the ran...

Embodiment 2

[0161] (1) Experimental data collection

[0162] Nigang Road is an east-west expressway in Shenzhen City, with a total length of 3.4 kilometers. It starts from the Nigang Overpass in the west and connects with Beihuan Avenue, and ends in the east with the Honghu Overpass and connects with Buxin Road. There is a Nigang Road in the middle. From Hongling Interchange, you can enter Yuping Avenue (Qingping Expressway) and Honggang Road to the north, and Hongling North Road to the south. There are also ramps to enter Qingshuihe 3rd Road and Honghu West Road to the south.

[0163] Composite the Shenzhen road network, the cellular grid network, and the position of the video bayonet with data in QGIS to form a base map, and number the corresponding cellular grids and OD points, such as Figure 14 shown.

[0164] Among them, the circles represent different ramp entrances, representing 8 OD communities; the small dots represent the 6 video checkpoints where data can be collected on Niga...


PUM


Abstract

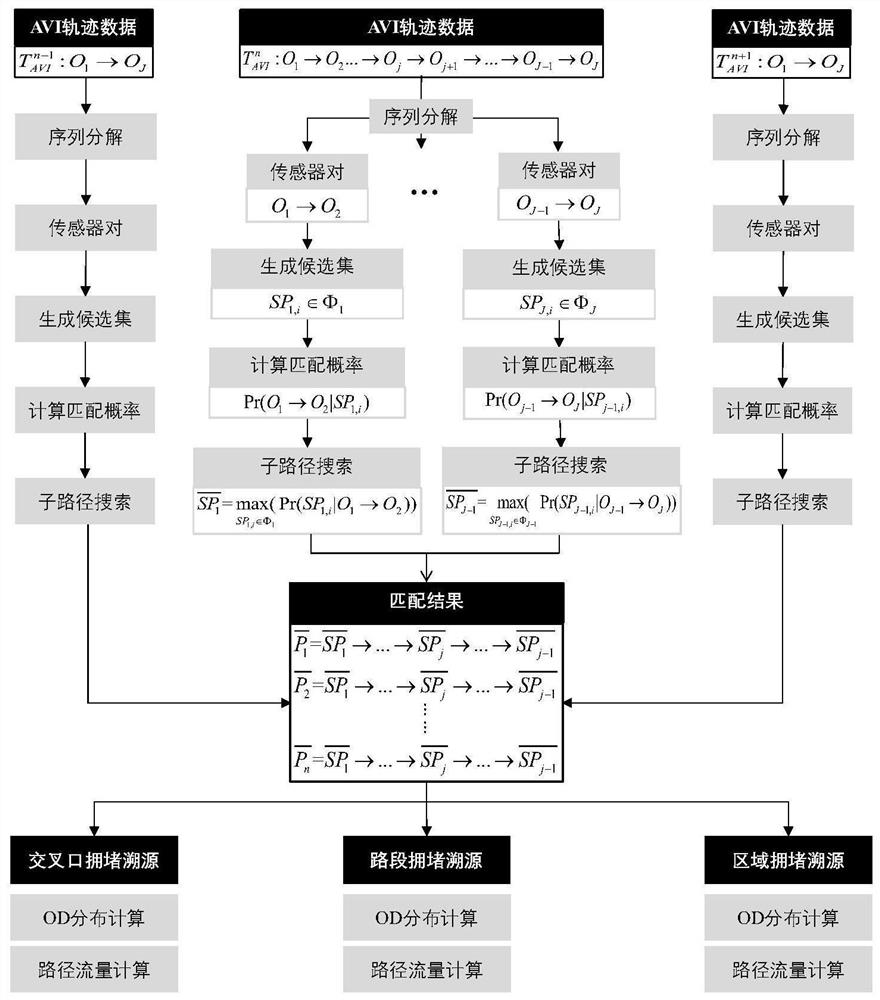
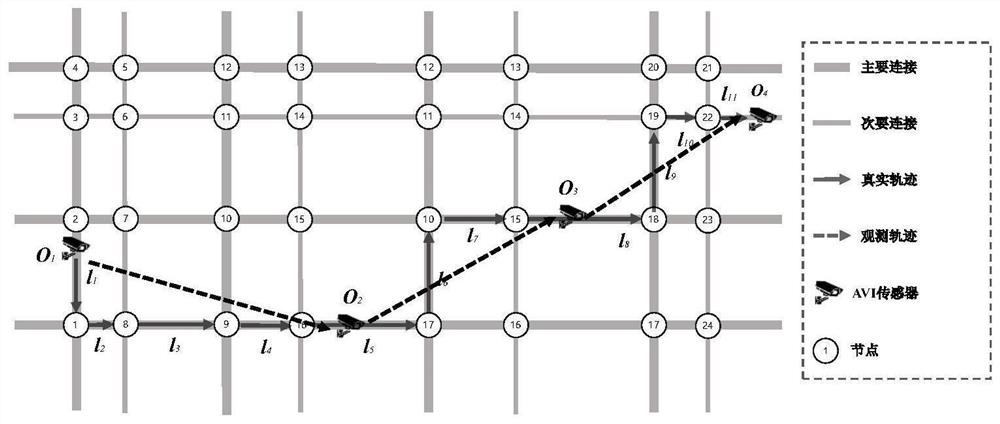
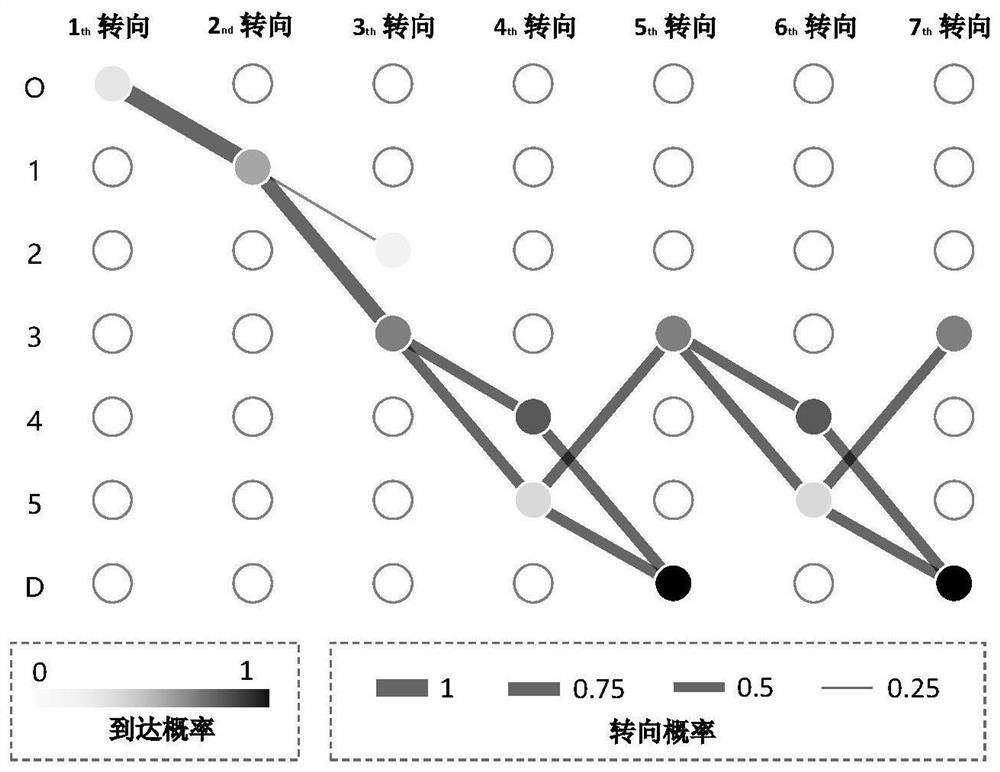
The invention provides a traffic jam tracing method based on multi-source data. The method comprises a map matching algorithm (AVI-MM) based on the multi-source data and a multi-level traffic jam tracing algorithm. The AVI-MM algorithm fuses sparse AVI data and massive GPS data, firstly, a vehicle path candidate set is generated based on a random walk algorithm, then, a prior probability is determined based on a Logit path selection model with the maximum utility, a conditional probability is defined through space-time fusion analysis, and finally, sub-paths with the maximum matching probability are communicated in sequence to obtain a final full path; the multi-level traffic jam traceability algorithm is based on a map matching result, and multi-level vehicle track OD distribution of road sections, nodes and areas is calculated respectively. According to the method, high-precision matching of the quasi-full-sample vehicle track and the driving path is realized, and based on the path matching result of the quasi-full-sample AVI data, the origin-destination distribution and the path distribution of the traffic flow of the congested road section are quantitatively analyzed.

Description

technical field [0001] The invention belongs to the field of urban traffic control and management, and in particular relates to a traffic jam tracing method based on multi-source data. Background technique [0002] Tracing the source of traffic congestion refers to tracing the starting and ending positions and driving paths of vehicles outside a certain spatial range. By tracing the source of traffic flow and identifying its destination, it provides strong support for the formulation of traffic control strategies. [0003] Map matching is to calibrate the vehicle position information by expressing the road segment by segment on the digital map. First, the sample vehicle trajectory data is matched to the road network through the map matching algorithm, and then the source of traffic flow passing through the observed road segment, intersection or area can be obtained. and whereabouts, and finally realize the traceability of vehicle congestion. Therefore, map matching is an im...

Claims


Application Information

Patent Timeline
IPC IPC(8): G08G1/01
CPCG08G1/0125G08G1/0129G08G1/0137
Inventor 任刚海天睿王亚琨曹奇李大韦
Owner SOUTHEAST UNIV
Learn More