Classified data multi-view visual coloring method and system based on similar significance

A technology for classifying data and multiple views, applied in the field of data visualization, can solve problems such as indistinguishability, and achieve the effect of improving efficiency and similarity.

Active Publication Date: 2021-09-03
SHANDONG UNIV
View PDF6 Cites 3 Cited by
  • Summary
  • Abstract
  • Description
  • Claims
  • Application Information

AI Technical Summary

Problems solved by technology

The existing technology only colorizes a single data, and the characteristics of different data are different. Direct application will make it difficult to distinguish between certain categories

Method used


Image

  • Classified data multi-view visual coloring method and system based on similar significance
  • Classified data multi-view visual coloring method and system based on similar significance
  • Classified data multi-view visual coloring method and system based on similar significance

Examples


Embodiment 1

[0065] This embodiment provides a multi-view visual coloring method for classified data based on similarity saliency, such as figure 1 As shown, it specifically includes the following steps:

[0066] Step 1: Load multiple classification data, select the mode: palette color assignment, palette color generation. Among them, selecting the allocation mode requires the user to specify a color palette.

[0067] The classified data are scatter plots, line charts, histograms and the like.

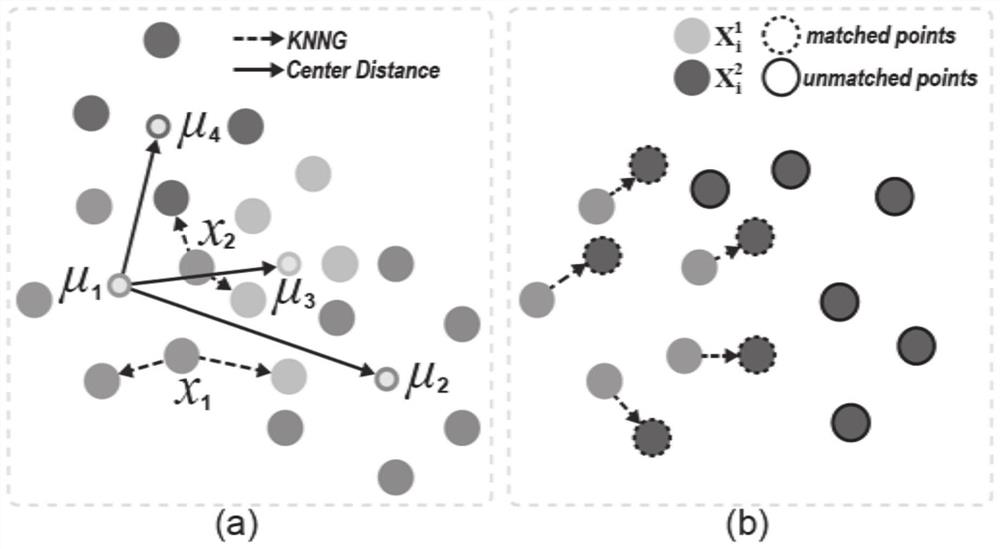
[0068] Given multiple datasets with the same class label, the jth data X j Contains M classes and n j data point where each point has class label while the i-th class contains points All visual rendering results use the same background color c b and the same colormap

[0069] It should be noted that the initial solution of the allocation scheme is a given color palette, and the generation scheme is to randomly generate several colors.

[0070] Step 2: Project the classification da...

Embodiment 2

[0115] The purpose of this embodiment is to provide a multi-view visual coloring system for classification data based on similarity saliency, including:

[0116] Load data module, receive classification data and palette;

[0117] A measurement data module, projecting the classified data into a visual space, obtaining the location information of the classified data, and calculating the difference between different classified data;

[0118] A significance calculation module, based on the location information and the significance of the data difference measurement class;

[0119] The palette optimization module recombines the palette or randomly selects multiple colors from the discretized color space as the initial solution, combines the separation and change information between classes, and quickly finds an approximate optimal solution based on the simulated annealing algorithm. generate palette;

[0120] The data rendering module renders the classification data based on the ...

Embodiment 3

[0122] The purpose of this embodiment is to provide an electronic device.

[0123] In order to achieve the above object, this embodiment provides an electronic device, including a memory, a processor, and a computer program stored on the memory and operable on the processor, and the steps of the above method are implemented when the processor executes the program .


PUM


Abstract

The invention provides a classifiied data multi-view visual coloring method and system based on similar saliency. The method comprises the following steps: receiving classification data; projecting the classified data to a visual space, and obtaining position information of the classified data; measuring the separation degree between each class of data based on the position information, and calculating change information of the same class on different classification data based on similarity measurement; recombining the color palettes or randomly selecting a plurality of colors from the discretized color space as initial solutions, and searching an approximate optimal solution based on a simulated annealing algorithm by combining the separation degree and change information between classes to generate the color palettes; and rendering the classification data based on the optimal palette. The simulated annealing algorithm is adopted, the given palette can be rapidly redistributed or the palette can be directly generated, meanwhile, distribution in data and changes between the data are considered, color difference measurement is combined, the similar significance of the changed area is improved, the intra-class distinction degree is kept, and the efficiency of visual analysis is improved.

Description

technical field [0001] The disclosure belongs to the technical field of data visualization, and in particular relates to a multi-view visual coloring method and system for classified data based on similarity salience. Background technique [0002] The statements in this section merely provide background information related to the present disclosure and do not necessarily constitute prior art. [0003] Comparison is an indispensable task in the process of data analysis and visualization. We often need to find a class that has changed in multiple labeled data, and this comparison task is usually completed in the form of a side-by-side view. Applicable methods are histograms, line charts, and scatter plots, and regardless of the visualization, each class is represented by a unique color. Color is important for people to detect differences, however, finding an appropriate coloring scheme remains a challenging and unsolved problem. To address this problem, we looked for a solut...

Claims


Application Information

Patent Timeline
Patent Type & Authority Applications(China)
IPC IPC(8): G06T11/40G06K9/62
CPCG06T11/40G06F18/24147G06F18/22
Inventor 汪云海卢克成曾琼华博解文龙
Owner SHANDONG UNIV
Why Eureka
Try Eureka