A single-station landslide deformation monitoring and early warning method based on gnss environment model
An environmental model and deformation monitoring technology, which is applied to alarms, measuring devices, and radio wave measurement systems, can solve the problems of high early warning costs and low success rates, and achieve the effect of reducing monitoring costs
- Summary
- Abstract
- Description
- Claims
- Application Information
AI Technical Summary
Problems solved by technology
Method used
Image
Examples
Embodiment 1
[0038] Example 1: This example designs a single-station landslide deformation monitoring and early warning method based on the GNSS environment model, which is mainly used to propose a new monitoring and early warning method based on consumer-grade single-frequency GNSS. figure 1 The method flow chart is described in detail.
[0039] S1: Deploy terminal equipment and collect data
[0040] Deploy the GNSS application terminal on the monitoring point (landslide deformation feature point), and collect the original observation data of the monitoring point through a wireless communication network such as 4G or 5G after starting up, and the original observation data includes the original pseudorange and ephemeris data; Among them, the GNSS application terminal can be selected as consumer-grade single-frequency GNSS, or it can be a professional type with centimeter-level accuracy or an ordinary measurement type with sub-meter-level accuracy. GNSS includes one or more of BDS / GPS / GLONA...
Embodiment 2
[0062] Example 2: In this example, the method in Example 1 is used for actual measurement, and the data of a landslide monitoring point in the creep stage is selected for the experiment. The monitoring point gradually sinks over time, and the original observation data is collected and the environment model, the results are figure 2 shown, figure 2 The direction indicated by the arrow in the middle represents the modeling results of 19 consecutive weeks from the 1st week to the 19th week. It can be seen that with the creep movement of the monitoring point, the satellite elevation angle of the environmental model at the same azimuth gradually increases.
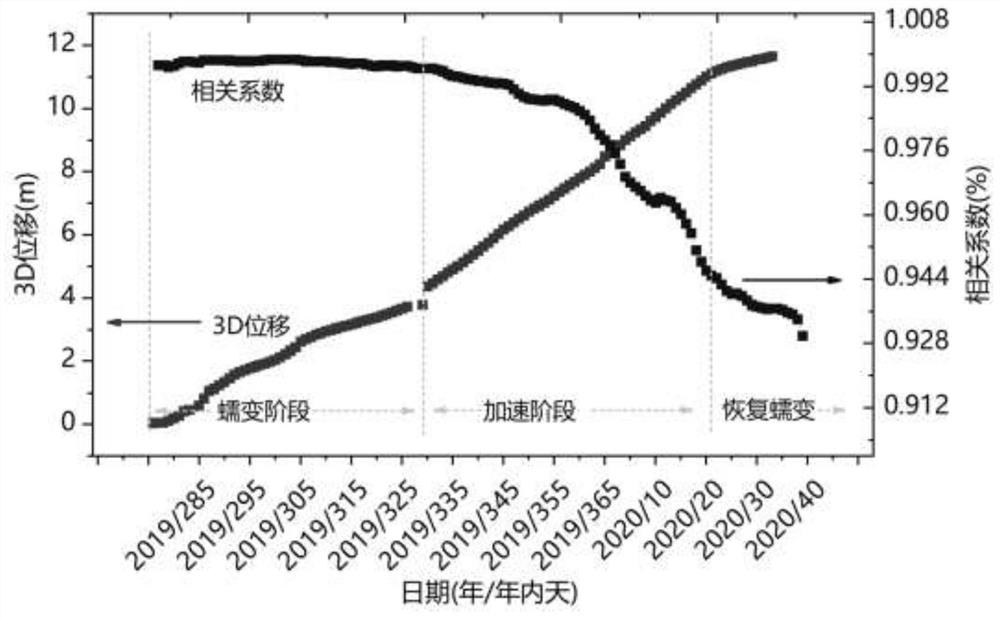
[0063] combine image 3 Given the three-dimensional position change and correlation coefficient time series diagram of the monitoring point, image 3 The middle horizontal axis represents the time axis, the left vertical axis represents the 3D vector displacement, and the right vertical axis represents the correlation coeff...
PUM
 Abstract
Description
Claims
Application Information
 - R&D Engineer
- R&D Manager
- IP Professional
- Industry Leading Data Capabilities
- Powerful AI technology
- Patent DNA Extraction
Browse by: Latest US Patents, China's latest patents, Technical Efficacy Thesaurus, Application Domain, Technology Topic, Popular Technical Reports.
© 2024 PatSnap. All rights reserved.Legal|Privacy policy|Modern Slavery Act Transparency Statement|Sitemap|About US| Contact US: help@patsnap.com


