
Science and technology service industry development level prediction method based on multiple linear regression

A technology of multiple linear regression and forecasting methods, applied in the field of scientific and technological services, can solve the problems of not yet forming a unified statistical index system, inconsistent statistical indicators, and unclear range of statistical objects in the scientific and technological services industry, so as to achieve reasonable prediction results and improve the impact factors, developmental effects

Inactive Publication Date: 2018-11-13
祝恩元
View PDF5 Cites 9 Cited by
  • Summary
  • Abstract
  • Description
  • Claims
  • Application Information

AI Technical Summary

Problems solved by technology

"The science and technology service industry occupies an increasingly important position in the entire national economy, and plays an important role in promoting industrial upgrading and economic transformation. However, the statistical work of the science and technology service industry is still in its infancy nationwide, and has not yet formed A unified and scientific statistical indicator system
At the same time, in the provinces that have carried out the statistics of the science and technology service industry, they are faced with problems such as unclear scope of statistical objects of the science and technology service industry, and inconsistent statistical indicators.

Method used


Image

  • Science and technology service industry development level prediction method based on multiple linear regression
  • Science and technology service industry development level prediction method based on multiple linear regression
  • Science and technology service industry development level prediction method based on multiple linear regression

Examples


Embodiment

[0046]Step 1: Sort out relevant research literature, collect statistics on the statistical indicators of the science and technology service industry in the existing literature, and use the frequency analysis method to arrange the indicators in the existing literature in descending order of frequency of use. According to the needs of industry statistical information from high to low, select the required high-frequency indicators as the statistical indicators of the scientific and technological service industry of the present invention, and establish a corresponding index system. Service industry statistical survey index system, and use the established scientific and technological service industry survey and statistical index system to carry out statistical surveys, and collect sample data on the development of Shandong's scientific and technological service industry in the past 15 years.

[0047] Step 2: Take the time series historical data of the development level indicators of...


PUM


Abstract

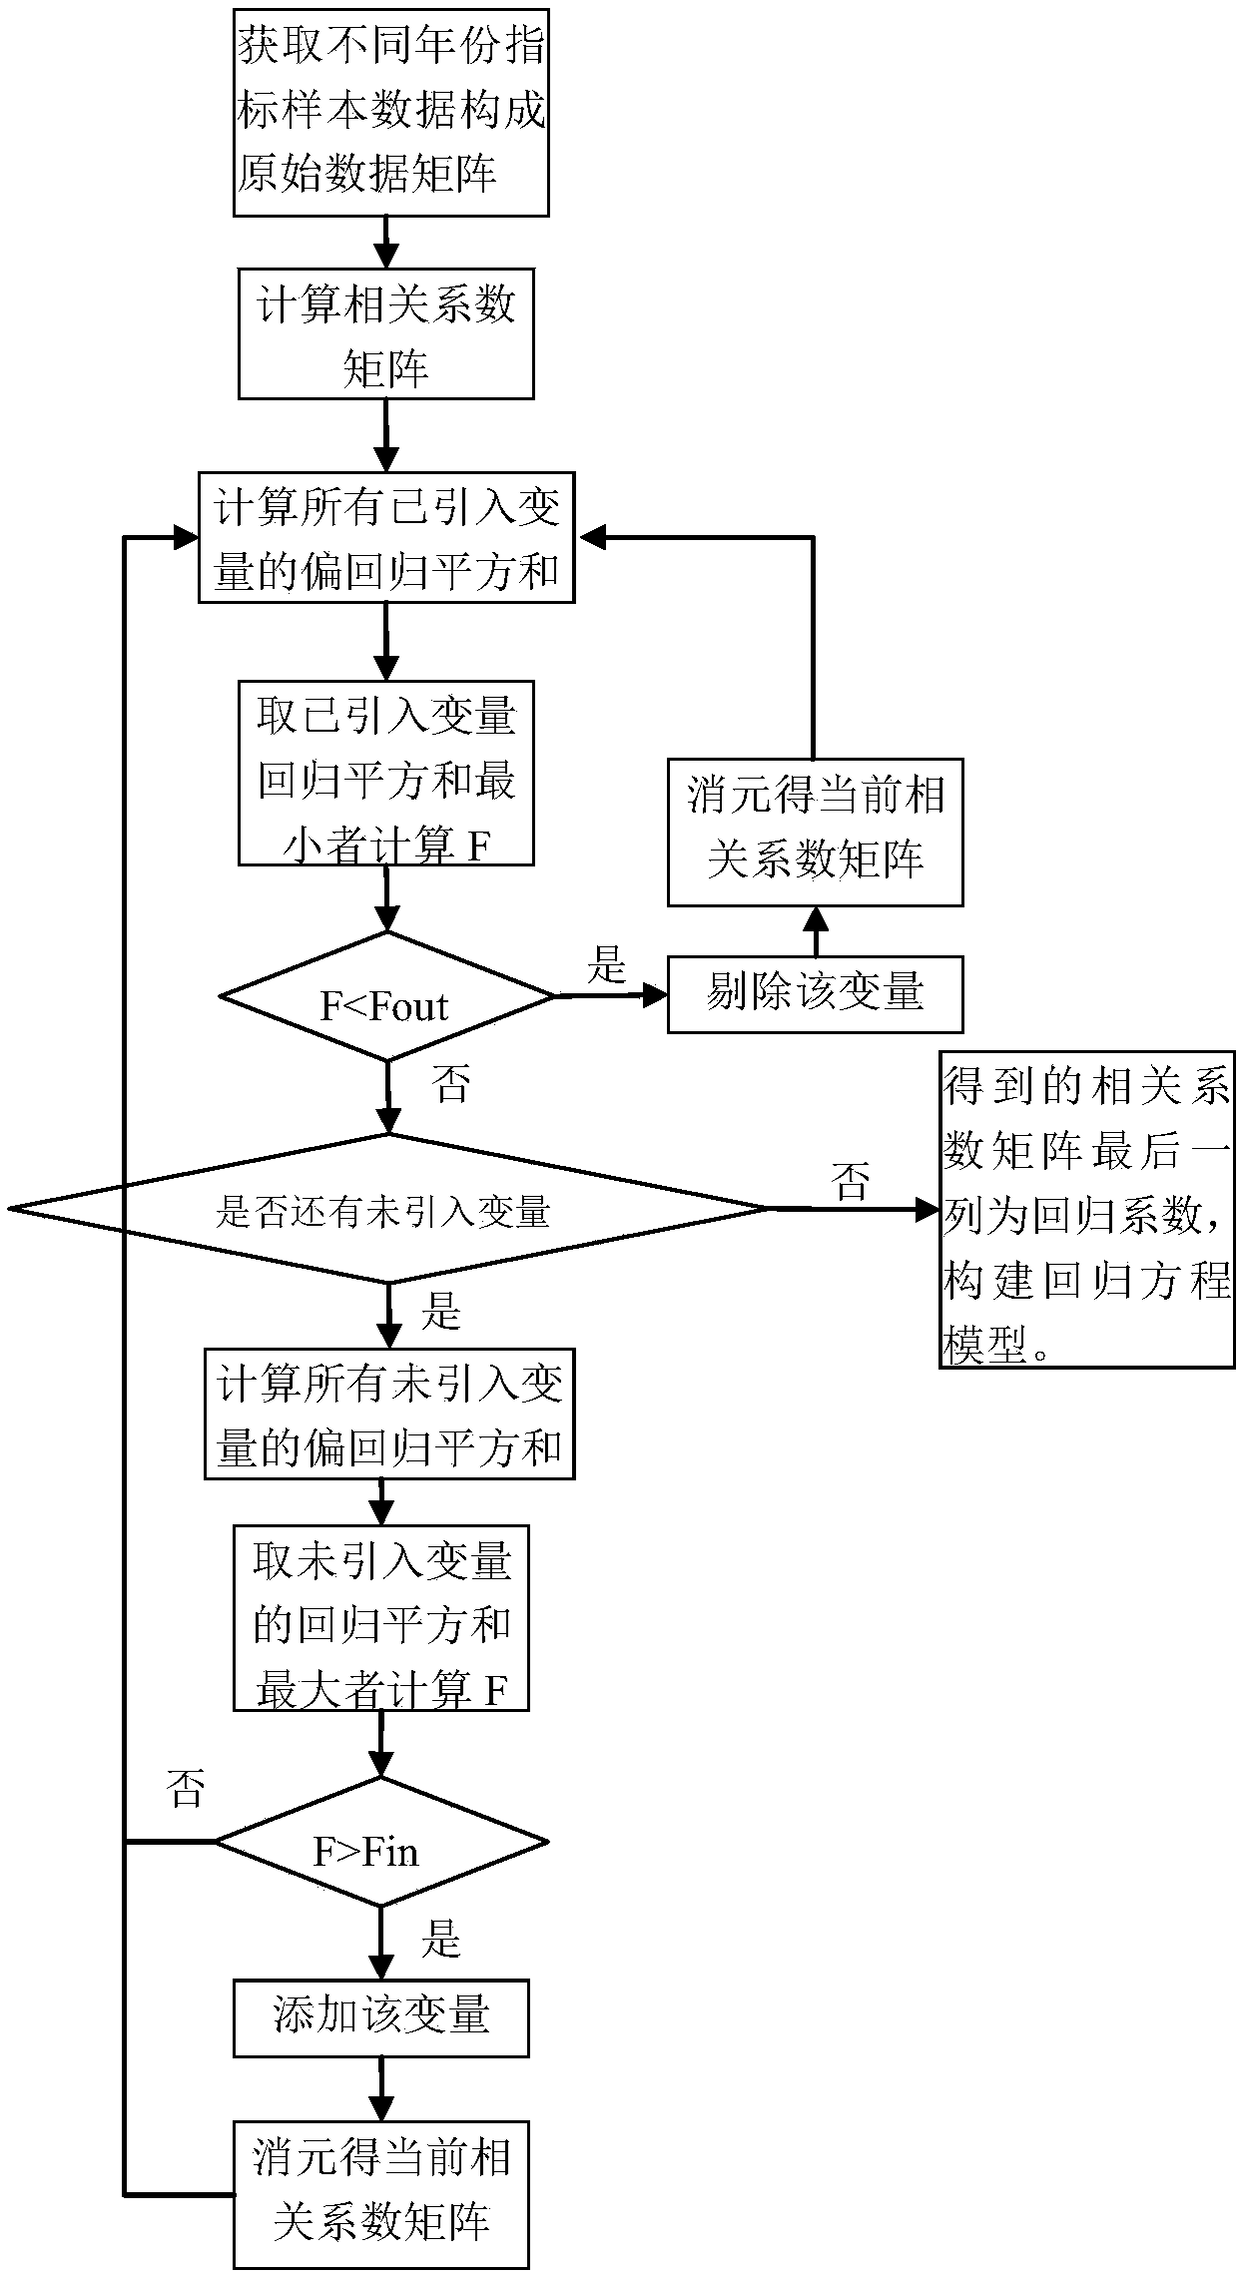
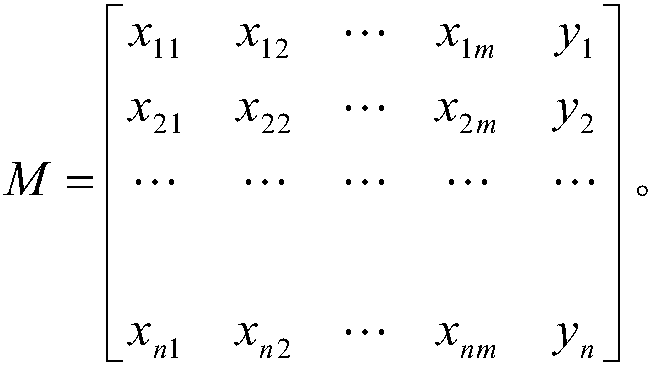
The invention discloses a science and technology service industry development level prediction method based on multiple linear regression. The method comprises the following steps that: collecting andcarrying out statistics on science and technology service industry statistical indexes in an existing document, utilizing a frequency analysis method to select a required high-frequency index as thescience and technology service industry statistical index of the method, and establishing a corresponding index system; selecting an index to be predicted from indexes which reflect a science and technology service industry output level as a dependent variable, taking rest indexes as independent variables, and constructing a science and technology service industry index sample matrix; calculatingthe relevant coefficient matrix of the science and technology service industry index sample matrix; on the basis of a step-by-step multiple linear regression algorithm, adopting a proper criterion toselect independent variables as few as possible, and establishing a science and technology service industry development level prediction model; and predicting the selected dependent variable. By use of the method, the independent variable index which affects science and technology service industry development can be dynamically screened, so that the selected index can more accurately predict the dependent variable development, and the development of the science and technology service industry is accelerated.

Description

technical field [0001] The invention relates to the field of science and technology service industry, in particular to the analysis and prediction of the development level of the science and technology service industry, and more specifically to a method for predicting the development level of the science and technology service industry based on multiple linear regression. Background technique [0002] The science and technology service industry is an industry that provides various intellectual services for scientific and technological innovation and the commercialization of scientific and technological achievements relying on science and technology and other professional knowledge. The science and technology service industry has basic characteristics such as knowledge-intensive, technological service means, specialization of service objects, systematic service, professional service and externality of service benefits, and plays an important role in promoting scientific and te...

Claims


Application Information

Patent Timeline
Patent Type & Authority Applications(China)
IPC IPC(8): G06Q10/04G06Q10/06G06Q50/10
CPCG06Q10/04G06Q10/06393G06Q50/10
Inventor 祝恩元韩慧健贾可亮刘峥韩佳兵闫凡慧王溪张琳
Owner 祝恩元
Learn More