A Statistical Analysis-Based Model Validation Method for Small-Sample Data
A verification method and data model technology, applied in special data processing applications, complex mathematical operations, design optimization/simulation, etc., can solve the problems of low accuracy of estimation results, and the distribution of reproduced samples deviates from the true distribution, so as to improve the accuracy, The effect of improving the accuracy and extending the range
- Summary
- Abstract
- Description
- Claims
- Application Information
AI Technical Summary
Problems solved by technology
Method used
Image

Examples
specific Embodiment approach 1
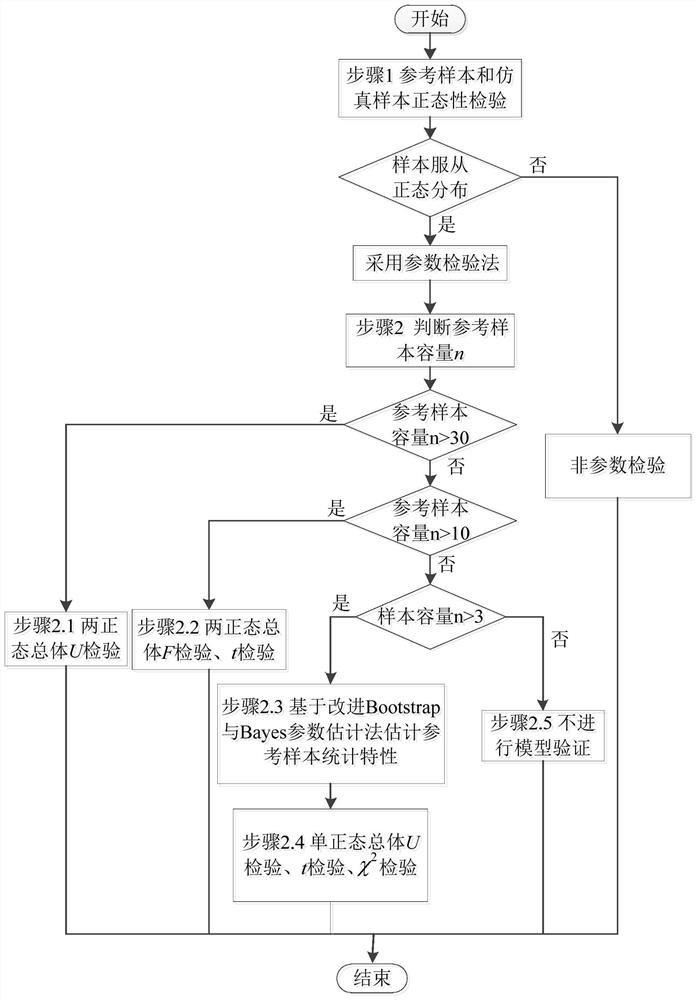
[0023] Embodiment 1: The specific process of a method for verifying a sample data model based on statistical analysis in this embodiment is as follows:
[0024] Step 1. Perform normality test on the reference sample and the simulated sample. If the reference sample and the simulated sample obey the normal distribution, perform step 2. Otherwise, use the nonparametric test method to analyze the similarity of the cumulative probability distribution of the reference sample and the simulated sample. degree;
[0025] The reference sample is experimental data of a real physical system, such as experimental data obtained by an aircraft system;
[0026] The simulation sample is experimental data obtained from a simulation model corresponding to a real physical system, such as experimental data of an aircraft simulation model;
[0027] The nonparametric test method includes K-S test, signed rank test, and runs test;
[0028] Step 2: Determine the reference sample size n, and select t...
specific Embodiment approach 2
[0035] Embodiment 2: The difference between this embodiment and Embodiment 1 is that in the step 1, the normality test is performed on the reference sample and the simulated sample, and the specific process is as follows:
[0036] Described normality test adopts W test method, and W test method selects index quantity to be:
[0037]
[0038] Among them, n is the sample size, when n is an even number, k=n / 2; when n is an odd number, k=(n-1) / 2;
[0039] X (1) ≤X (2) ≤...X (n) Sort the samples in ascending order;
[0040] a k is the calculation coefficient (available from the table);
[0041] The rejection domain of the W-test method is W≤W a ,
[0042] W a is the alpha quantile (available from the table), and alpha is the significance level;
[0043] An example of a normality test is given below:
[0044] For example, there are 10 groups of data: 2.7, -1.2, -1.0, 0, 0.7, 2.0, 3.7, -0.6, 0.8, -0.3, use the W test to test whether the group of data obeys a normal distr...
specific Embodiment approach 3
[0050] Embodiment 3: This embodiment differs from Embodiment 1 or 2 in that: in step 2.1, when the reference sample size n≥30, the U-test method of the two-normal population mean is used to check the difference between the reference sample and the simulated sample. Consistency analysis is carried out to obtain whether the mean values of the reference sample and the simulation sample are consistent; the specific process is as follows:
[0051] Let the reference sample X = (X 1 ,…,X n ) follows a normal distribution N(μ 1 ,σ 1 2 ), simulation sample Y=(Y 1 ,…,Y m ) obey the normal population N(μ 2 ,σ 2 2 );
[0052] (X 1 ,…,X n ) is the experimental data of n real physical systems, that is, the reference sample; (Y 1 ,…,Y m ) is the experimental data output by the m simulation model, that is, the simulation sample; n is the reference sample size, m is the simulation sample size; m, n are both positive integers; μ 1 is the mean of the overall experimental data of ...
PUM
 Abstract
Description
Claims
Application Information
 - R&D
- Intellectual Property
- Life Sciences
- Materials
- Tech Scout
- Unparalleled Data Quality
- Higher Quality Content
- 60% Fewer Hallucinations
Browse by: Latest US Patents, China's latest patents, Technical Efficacy Thesaurus, Application Domain, Technology Topic, Popular Technical Reports.
© 2025 PatSnap. All rights reserved.Legal|Privacy policy|Modern Slavery Act Transparency Statement|Sitemap|About US| Contact US: help@patsnap.com