
Systems and methods for predicting outcomes using a prediction learning model

A group, non-temporary technology, applied in computational modeling, machine learning, medical simulation, etc.

Inactive Publication Date: 2018-04-17
AYASDI
View PDF1 Cites 29 Cited by
  • Summary
  • Abstract
  • Description
  • Claims
  • Application Information

AI Technical Summary

Problems solved by technology

In contrast, previous methods required formulation of assumptions prior to testing

Method used


Image

  • Systems and methods for predicting outcomes using a prediction learning model
  • Systems and methods for predicting outcomes using a prediction learning model
  • Systems and methods for predicting outcomes using a prediction learning model

Examples


Embodiment Construction

[0055] Some of the embodiments described herein may be part of the topic of topological data analysis (TDA). TDA is a research field that has produced several methods for studying point cloud datasets from a geometric perspective. Other data analysis techniques use various types of "approximate models." For example, regression methods model data as graphs of functions of one or more variables. Unfortunately, certain qualitative properties, which one can readily observe when the data are two-dimensional, may be of paramount importance to understanding, but these may not be readily represented within such models.

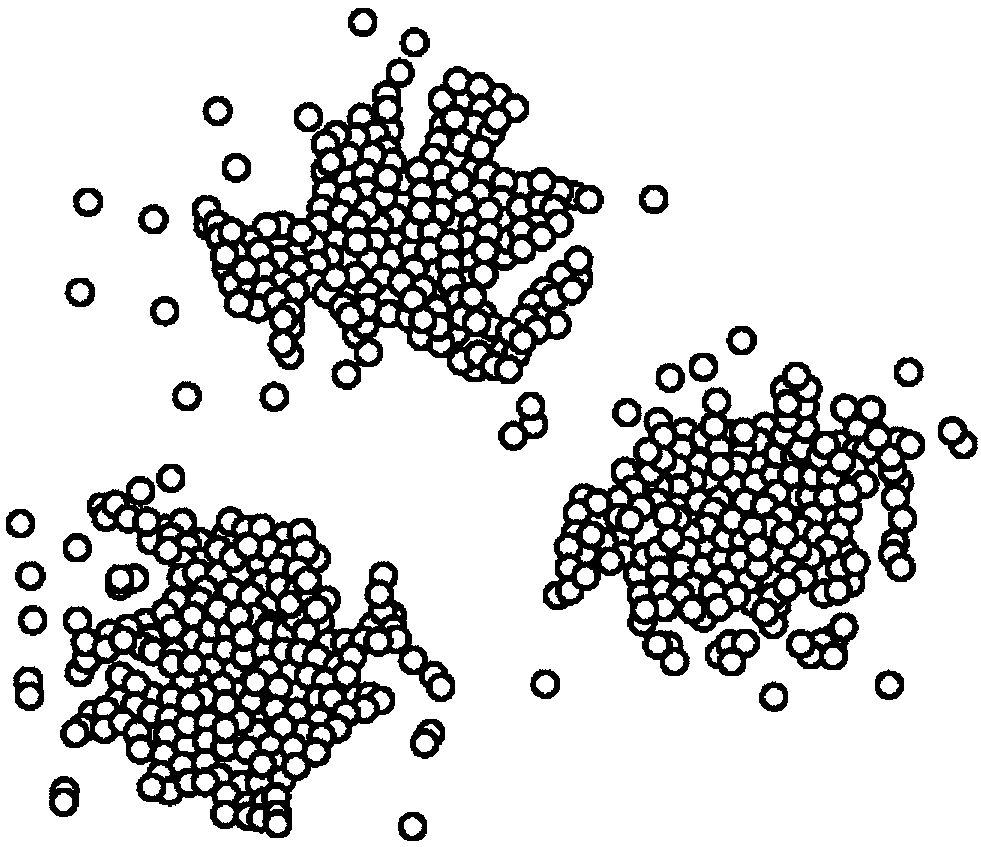
[0056] Figure 1a is an example graph representing data that appears to be partitioned into three non-connected groups. In this example, the data used for this graph may be associated with biomedical data on various physical characteristics of different population groups or on different forms of disease. It has been found that breaking down data into groups in this ...


PUM


Abstract

A method comprises the steps of: receiving a network of a plurality of nodes and a plurality of edges, each of the nodes comprising members representative of at least one subset of training data points, each of the edges connecting nodes that share at least one data point, grouping the data points into a plurality of groups, each data point being a member of at least one group, creating a first transformation data set, the first transformation data set including the training data set as well as a plurality of feature subsets associated with at least one group, values of a particular data pointfor a particular feature subset for a particular group being based on values of the particular data point if the particular data point is a member of the particular group, and applying a machine learning model to the first transformation data set to generate a prediction model.

Description

technical field [0001] Embodiments of the present invention are directed to grouping data points for data analysis and, more particularly, to generating graphs with improved grouping of data points based on grouping scores. Background technique [0002] As more data is collected and stored, so does the need to analyze large amounts of data and make sense of it. Examples of large data sets can be found in financial services companies, oil expiration, biotech, and academia. Unfortunately, prior analysis methods on large multidimensional datasets are often insufficient (if possible) to identify important relationships and can be computationally inefficient. [0003] In one example, previous analysis methods often use clustering. Clustering is often too ineffective as a means of identifying important relationships in data. Similarly, previous methods of linear regression, projection pursuit, principal component analysis, and multidimensional scaling often do not reveal import...

Claims


Application Information

Patent Timeline
Patent Type & Authority Applications(China)
IPC IPC(8): G06F15/18G06N20/00
CPCG06N5/025G16H50/50G16H50/20G06N20/00G06F11/3048G06F16/35G06F16/75G06F16/285G06F16/45G06F16/906G06F16/55G06F16/65G05B23/0281G06F18/23G06F18/2137G06N7/01G06N3/04
Inventor G·卡尔松
Owner AYASDI
Learn More