A bar graph drawing device for teaching economics

A bar graph and economics technology, applied in printing, writing utensils, etc., can solve the problems of unfavorable teaching quality and low efficiency, and achieve the effect of solving cumbersome use, simple structure, and saving drawing time

Active Publication Date: 2019-01-22
WEIFANG UNIV OF SCI & TECH
View PDF13 Cites 0 Cited by
  • Summary
  • Abstract
  • Description
  • Claims
  • Application Information

AI Technical Summary

Problems solved by technology

[0002] The bar chart uses a unit length to represent a certain quantity, and draws straight bars of different lengths according to the quantity, and then arranges these straight bars in a certain order. It is easy to see various The amount of quantity is a statistical report chart that expresses graphics with the length of the rectangle as a variable, reflecting the specific data in each group, bar statistics Figure 1 Generally referred to as a bar graph, also called a long bar graph or a straight bar graph. The bar graph uses the length of the bar to represent the size of the quantity, which is convenient for comparison. The bar graph is divided into a bar graph and a compound bar graph. Statistical charts, compound bar charts are composed of various data, marked with different colors, which can clearly show the quantity. What are the advantages of the compound bar chart? It is easy to see how much the quantity is, and the bar graph is easy to compare the differences between the data. Especially in the teaching of economics courses, teachers need to use a ruler to draw a bar graph with chalk on the blackboard to explain the correspondence between various parameters. However, using a ruler to draw a bar graph is inefficient and not conducive to improving the quality of teaching

Method used


Image

  • A bar graph drawing device for teaching economics
  • A bar graph drawing device for teaching economics
  • A bar graph drawing device for teaching economics

Examples


Embodiment Construction

[0015] The following will clearly and completely describe the technical solutions in the embodiments of the present invention with reference to the accompanying drawings in the embodiments of the present invention. Obviously, the described embodiments are only some, not all, embodiments of the present invention. Based on the embodiments of the present invention, all other embodiments obtained by persons of ordinary skill in the art without making creative efforts belong to the protection scope of the present invention.

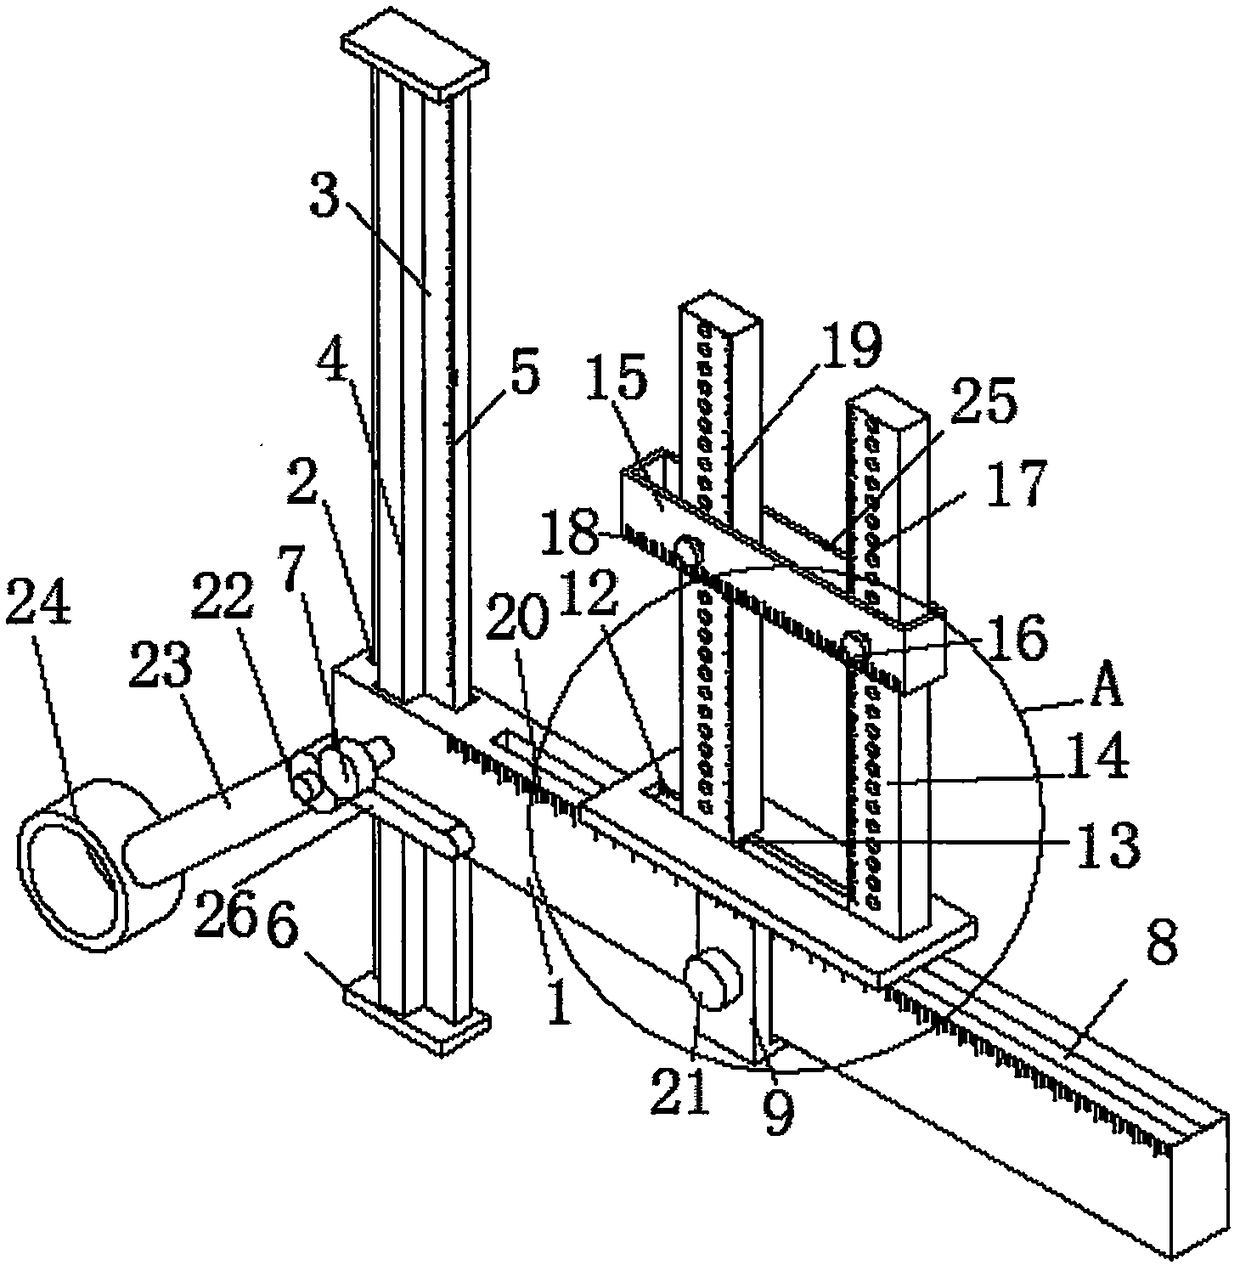
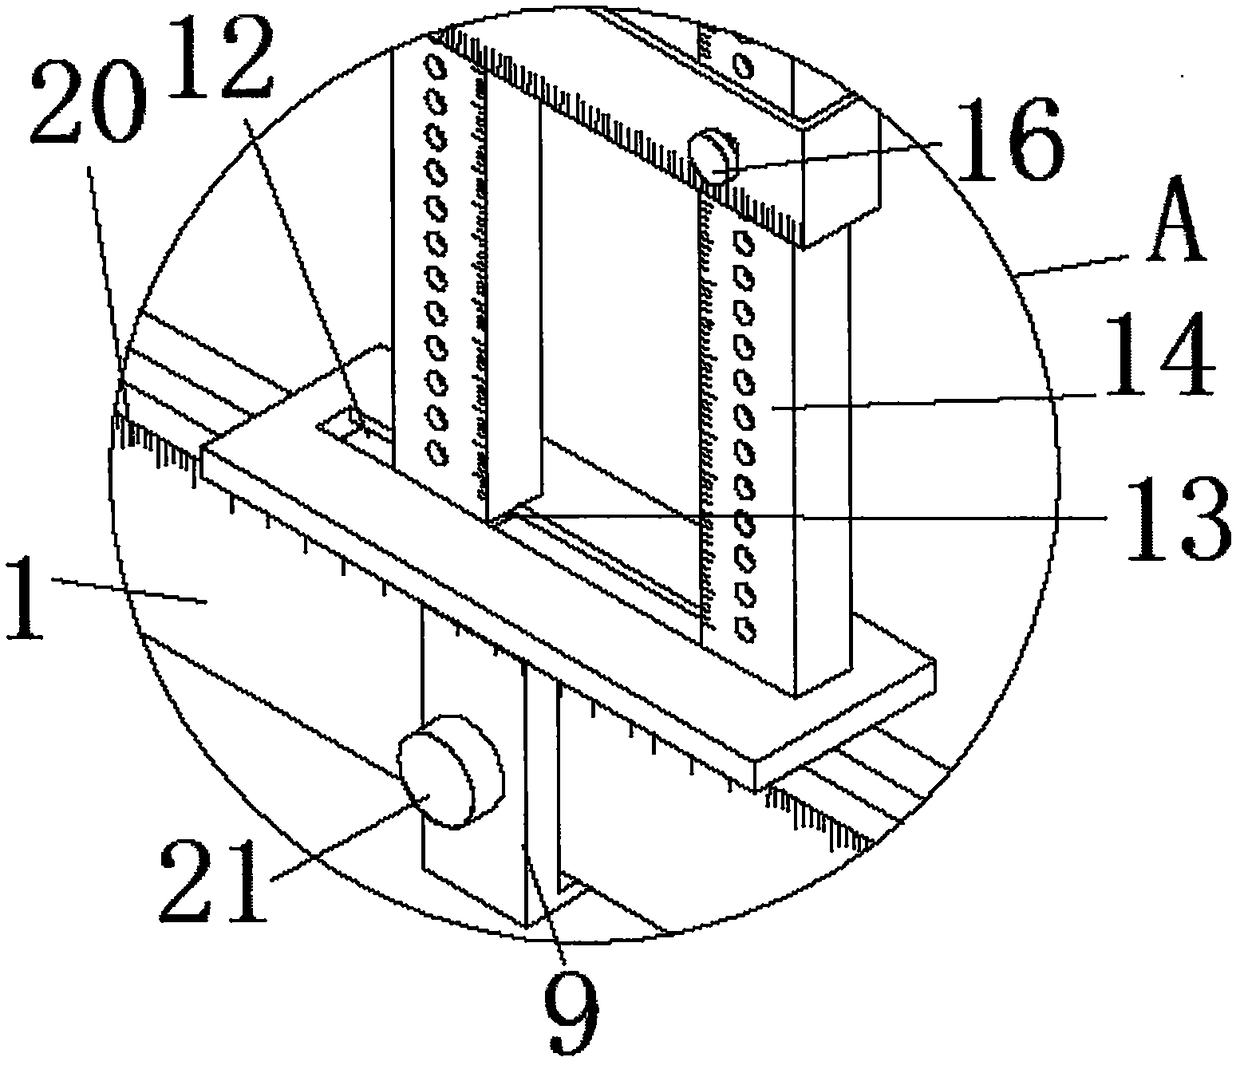
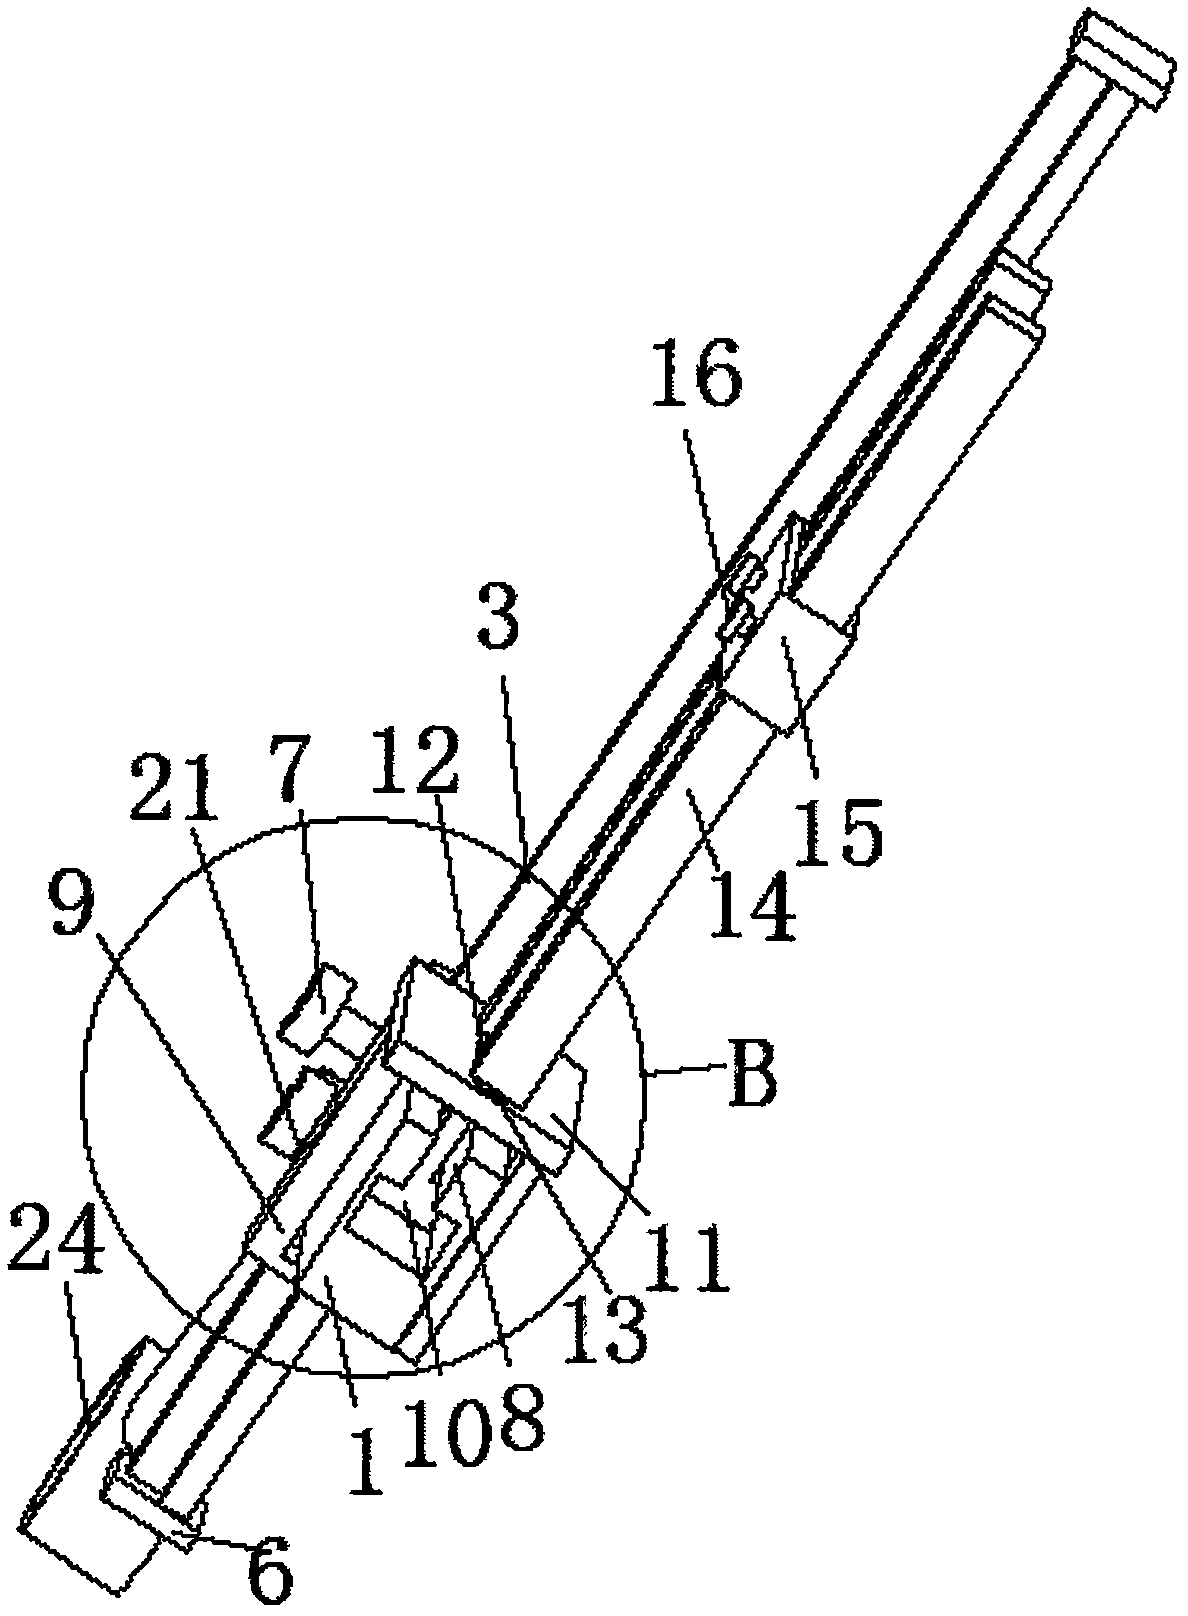
[0016] see Figure 1-4 , the present invention provides a technical solution: a bar graph drawing device for economics teaching, comprising a horizontal ruler 1 and an auxiliary horizontal ruler 15, the horizontal ruler 1 acts as a ruler to draw the horizontal axis of a frame diagram, and can also provide a horizontal axis for each equipment Cooperate with use to provide place, auxiliary horizontal ruler 15 acts as straightedge to draw the effect of each group...


PUM


Abstract

The invention discloses a bar chart drawing device for economics teaching. The bar chart drawing device comprises a transverse ruler and an auxiliary transverse ruler. Transverse ruler scale marks are arranged at the upper end of the front side of the transverse ruler. A T-shaped through groove is formed in the upper side of the left end of the transverse ruler. A vertical ruler is arranged at the bottom end inside the T-shaped through groove, and the width of the vertical ruler is smaller than the groove width of the T-shaped through groove. A sliding block strip is arranged in the middle of the front surface of the vertical ruler. The vertical ruler and the sliding block strip are integrated, and the vertical ruler is slidably connected with the T-shaped through groove. The bar chart drawing device for economics teaching is exclusive in design and simple in structure, and bar charts can be drawn rapidly; in addition, the widths and distances between bars of the bar charts can be adjusted as required, and great convenience is brought to using of a user; and furthermore, the defect that various drawing rulers are troublesome in using can be well overcome, multiple functions can be achieved through one ruler, the drawing time is shortened, and the drawing efficiency of the bar chart drawing device for economics teaching is further improved.

Description

technical field [0001] The invention relates to the technical field of economics teaching equipment, in particular to a bar graph drawing device for economics teaching. Background technique [0002] The bar chart uses a unit length to represent a certain quantity, draws straight bars of different lengths and shorts according to the quantity, and then arranges these straight bars in a certain order. It is easy to see various types of data from the bar chart. The amount of quantity is a statistical report chart that expresses graphics with the length of the rectangle as a variable, reflecting the specific data in each group, bar statistics Figure 1 Generally referred to as a bar chart, also called a long bar chart or a straight bar chart. The bar chart uses the length of the bar to represent the size of the quantity, which is convenient for comparison. The bar chart is divided into a bar chart and a compound bar chart. Statistical charts, compound bar charts are composed of v...

Claims


Application Information

Patent Timeline
Patent Type & Authority Patents(China)
IPC IPC(8): B43L13/00
CPCB43L13/001
Inventor 庞聪玲
Owner WEIFANG UNIV OF SCI & TECH
Why Eureka
Try Eureka