
Signal analysis device and method based on random variable digital intermediate frequency

A signal analysis method and digital intermediate frequency technology, applied in the field of signal analysis, can solve the problems of increasing hardware cost and power consumption of instruments, limited isolation of mixers, and impossible to completely eliminate them, so as to reduce circuit costs and increase addressing bits Number, the effect of improving precision

Active Publication Date: 2017-09-22
THE 41ST INST OF CHINA ELECTRONICS TECH GRP
View PDF4 Cites 8 Cited by
  • Summary
  • Abstract
  • Description
  • Claims
  • Application Information

AI Technical Summary

Problems solved by technology

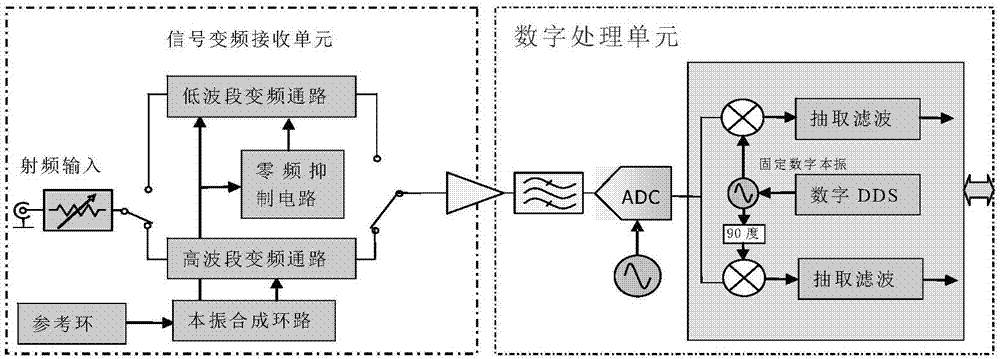
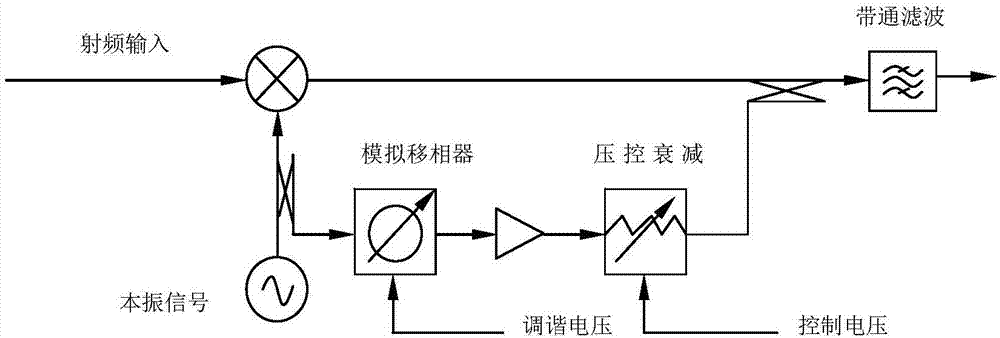
[0005] 1. The signal analyzer adopts a superheterodyne structure. Due to the limited isolation of the mixer, the local oscillator signal including the first local oscillator, the second local oscillator and even the third local oscillator will appear at the output of the mixer. In the intermediate frequency signal, the low frequency signal will be covered up, and the zero frequency suppression circuit is usually used to eliminate the leakage of the local oscillator signal to the intermediate frequency signal, adding additional circuits, requiring phase shifters, attenuation, and voltage generation circuits, which increases hardware costs and equipment. power consumption
[0006] 2. When the zero-frequency suppression circuit is used to cancel the local oscillator leakage, it can only be completely eliminated when the phase is strictly equal and reversed. However, there are deviations in actual engineering applications, and it is impossible to completely eliminate

Method used


Image

  • Signal analysis device and method based on random variable digital intermediate frequency
  • Signal analysis device and method based on random variable digital intermediate frequency
  • Signal analysis device and method based on random variable digital intermediate frequency

Examples


Embodiment 1

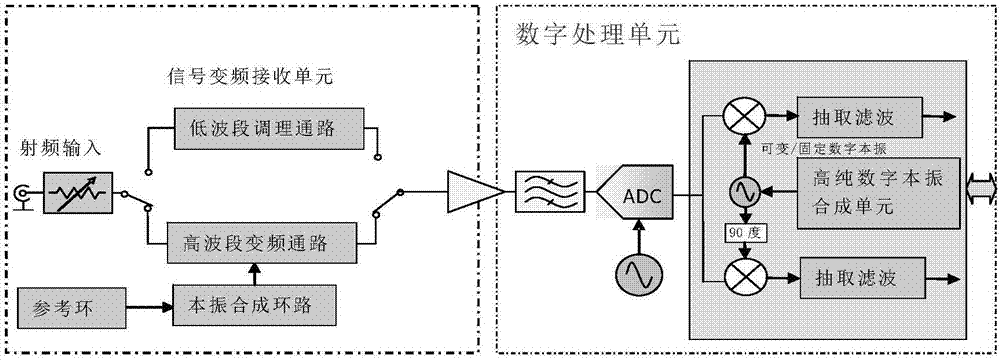
[0050] A signal analysis device based on any variable digital intermediate frequency, such as image 3 As shown, it includes a frequency conversion receiving unit, an intermediate frequency conditioning unit and a digital processing unit; the frequency conversion receiving unit, the intermediate frequency conditioning unit and the digital processing unit are connected by a line;

[0051]The frequency conversion receiving unit includes a programmable attenuator, a high-band frequency conversion channel, a low-band conditioning channel, a reference loop and a local oscillator synthesis loop;

[0052] a programmable attenuator configured to split the radio frequency input signal into two signals, a high-band signal and a low-band signal;

[0053] a high-band frequency conversion path configured to process a high-band signal;

[0054] a low-band conditioning pathway configured to process a low-band signal;

[0055] The local oscillator synthesis loop is configured to provide hig...

Embodiment 2

[0069] On the basis of the above-mentioned embodiments, the present invention also mentions a signal analysis method based on an arbitrary variable digital intermediate frequency, which specifically includes the following steps:

[0070] Step 1: The input RF signal is divided into low-band and high-band signals after being passed through a programmable attenuator;

[0071] Step 2: The high-band signal enters the intermediate frequency conditioning unit after passing through the high-band frequency conversion channel, wherein the local oscillator synthesis loop provides high-purity local oscillator signals for the high-band frequency conversion channel, and the reference loop provides reference signals for the local oscillator synthesis loop;

[0072] Step 3: The high-band signal enters the ADC converter after being processed by the fixed intermediate frequency of the intermediate frequency conditioning unit;

[0073] Step 4: The high-band signal collected by the ADC converter ...


PUM


Abstract

The invention discloses a signal analysis device and method based on random variable digital intermediate frequency and belongs to the field of signal analysis. According to the device and the method, for low band signals, a full digital down-conversion mode is employed, and an additional frequency conversion circuit and a zero frequency suppression circuit are removed, so the cost of a circuit, particularly the total power consumption of the circuit is reduced, a size of the circuit is greatly reduced, and a direct digital down-conversion function for the low band input signals is realized. Automatic full scale gain control and an adjustable digital mixing method are united, channel gain is automatically adjusted according to whether data collection number of bits is in a full scale or not, digital mixing effective number of bits is dynamically intercepted, and high-precision signal analysis is realized. Random sequence superposition and amplitude compression methods are combined, and high-purity digital local oscillation generation is realized. Compression is carried out based on a taylor series linear expansion method. The addressing number of bits of a lookup table is increased, high-purity digital local oscillation signals are generated, and the signal analysis precision is improved.

Description

technical field [0001] The invention belongs to the field of signal analysis, in particular to a signal analysis device and method based on an arbitrary variable digital intermediate frequency. Background technique [0002] The signal analyzer adopts a superheterodyne structure, and realizes the spectrum shift of the input signal through the frequency conversion of the mixer, and converts the frequency to the intermediate frequency for subsequent processing, such as figure 1 shown. An ideal mixer only generates the sum and difference frequencies of the radio frequency signal and the local oscillator signal at the intermediate frequency port, but in actual mixing, the fundamental wave and harmonic signals of the local oscillator and radio frequency also appear at the intermediate frequency port. When the LO frequency is the same as or close to the IF frequency, the LO leakage signal will be coupled into the IF signal through the IF filter, but the IF filter cannot eliminate ...

Claims


Application Information

Patent Timeline
Patent Type & Authority Applications(China)
IPC IPC(8): H04B1/10H04B1/16H04B1/26H04B1/525G01R23/165H03H17/06H03M1/12H03D7/16
CPCG01R23/165H03D7/16H03H17/0671H03M1/1245H04B1/10H04B1/16H04B1/26H04B1/525
Inventor 张光山张一民刘磊
Owner THE 41ST INST OF CHINA ELECTRONICS TECH GRP
Learn More