Eureka AIR delivers breakthrough ideas for toughest innovation challenges, trusted by R&D personnel around the world.

Multi-layer map displaying method based on services

A display method and multi-level technology, applied in geographic information databases, special data processing applications, instruments, etc., can solve problems such as indistinct presentation of peer relationships, difficult retrieval of tree diagrams, low degree of visualization, etc., to achieve hierarchical relationship display Clear, cross-platform use, high degree of visualization effect

Inactive Publication Date: 2016-07-20
上海新炬网络技术有限公司
View PDF2 Cites 16 Cited by
  • Summary
  • Abstract
  • Description
  • Claims
  • Application Information

AI Technical Summary

Problems solved by technology

[0003] 1), the tree diagram presents the business, the root business at the top level, all the way down to each sub-business, the degree of visualization is low, and it is inconvenient to browse
[0004] 2) The single-layer map presents the business, but puts all the business on the same layer map, including parent and child-level business. When the business volume is large, it cannot be screened and viewed as needed
[0006] 1) The tree diagram presents the business and can only display the hierarchical relationship, but the amount of information is not much, the peer relationship is not obvious, the degree of visualization is low, and when the business volume is large, the tree diagram will become very long and inconvenient to browse
And the tree diagram is difficult to retrieve, the operation is single, and the use is backward
[0007] 2) A single-layer map presents services, with too much labeling information, and it is difficult to clearly express the hierarchical relationship between services, which is very unsightly. When the business volume is large, the marked information cannot be grouped, there is no hierarchy, and all information is mixed and presented together, cannot be filtered to view as desired
And when a single-layer map presents services, since all services are displayed on the same layer, the rendering speed becomes a performance bottleneck

Method used


Image

  • Multi-layer map displaying method based on services
  • Multi-layer map displaying method based on services
  • Multi-layer map displaying method based on services

Examples


Embodiment Construction

[0024] The present invention will be further described below in conjunction with the accompanying drawings and embodiments.

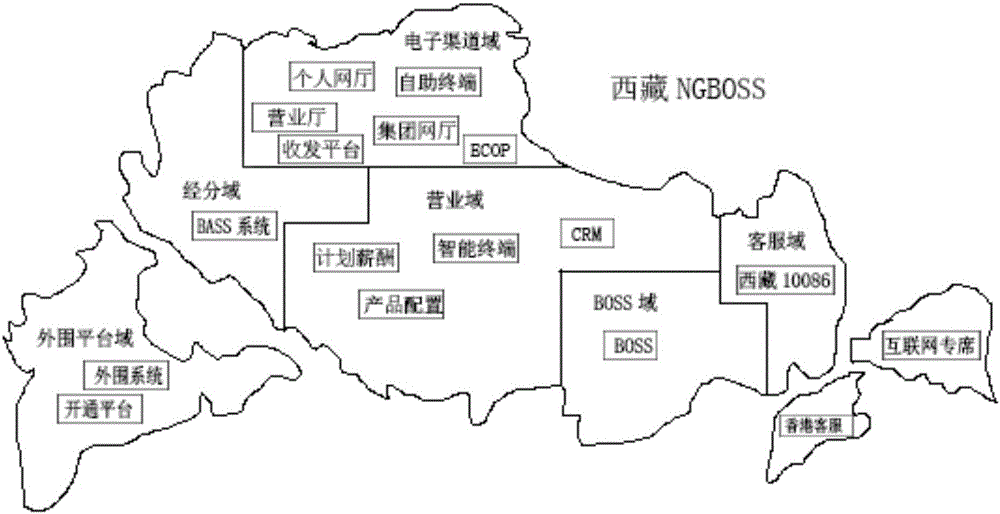
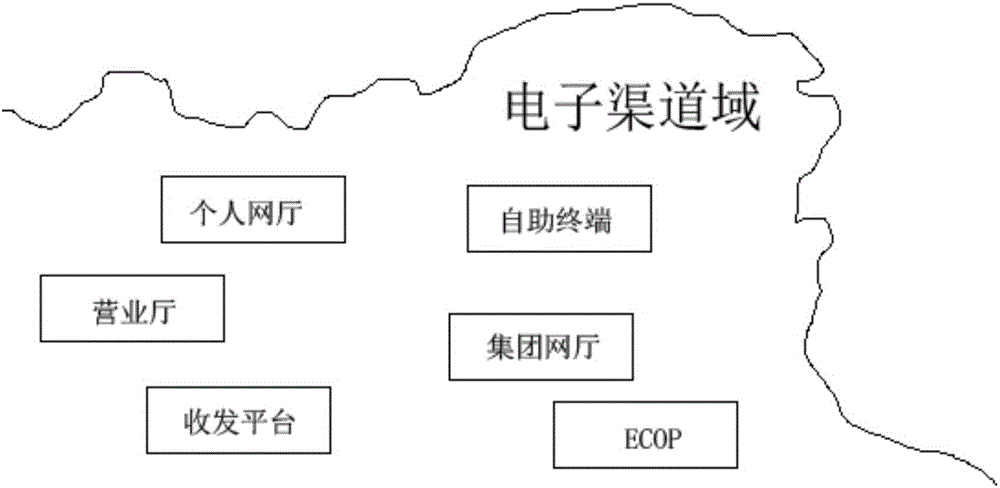
[0025] The present invention provides a business-based map multi-level display method, which displays all services in layers, and services of the same level are displayed in the same layer, and related information is clear at a glance.

[0026] now refer to figure 1 , figure 1 It is a flow chart of the business-based map multi-level display method of the present invention. The business-based map multi-level display method of the present invention includes the following steps: S11 acquires business resources; S12 divides the business resources into multi-level businesses; S13 sets multiple layers as business maps, and displays the business resources through a visual graphic display method The multi-level business is displayed in a one-to-one correspondence on multiple layers of the business map; S14 is switched to display different layers of the busine...


PUM


Abstract

The invention discloses a multi-layer map displaying method based on services.The method includes the following steps that service resources are obtained; the service resources are divided into multiple layers of services; multiple map layers are set to serve as a service map, and the multiple layers of services are subjected to layered displaying on the multiple map layers of the service map in a one-to-one corresponding mode with a visualization graph displaying method; the different map layers of the service map are switched for displaying through scaling; each layer of service corresponds to one map layer, the lower-layer services are nested into the upper-layer services, and the current layer of service and the upper-layer services are displayed on the current map layer.According to the multi-layer map displaying method based on services, the multiple layers of services are subjected to layered displaying on the multiple map layers of the map in the one-to-one corresponding mode with the visualization graph technology, the visualization degree is high, the service relationship is clear at a glance, the interface of the service map is simple, and the layer relationship is clearly displayed.

Description

technical field [0001] The invention relates to a map multi-level display method, in particular to a business-based multi-level map display method. Background technique [0002] Existing conventional methods for presenting hierarchical services include tree diagrams or single-layer maps: [0003] 1) The tree diagram presents the business, the root business at the top level, all the way down to each sub-business, the degree of visualization is low, and it is inconvenient to browse. [0004] 2) The single-layer map presents services, but all the services are placed on the same layer map, including parent and child services. When the business volume is large, it cannot be screened and viewed as needed. [0005] The above two conventional methods for presenting hierarchical services have the following disadvantages: [0006] 1) The tree diagram presents the business and can only display the hierarchical relationship, but the amount of information is not much, the peer relation...

Claims


Application Information

Patent Timeline
Patent Type & Authority Applications(China)
IPC IPC(8): G06F17/30
CPCG06F16/904G06F16/29
Inventor 程永新韩国盛岺润荣郭振宇
Owner 上海新炬网络技术有限公司
Why Eureka
Eureka Blog
Learn More