
Concentration measuring method

a concentration and measurement method technology, applied in the field of concentration measurement method, can solve the problems of prozone-like phenomenon, poor measurement resolution, and inability to perform the same analyte measurement a plurality of times, and achieve the effect of reducing resolution and preventing the deterioration of measurement accuracy

Inactive Publication Date: 2006-05-30
ARKRAY INC
View PDF10 Cites 111 Cited by
  • Summary
  • Abstract
  • Description
  • Claims
  • Application Information

AI Technical Summary

Benefits of technology

The present invention provides a method for accurately measuring the concentration of a target substance in a sample solution, even in high concentration ranges, without being affected by the prozone-like phenomenon or the resolution limitation. This is achieved by selecting and using multiple calibration curves, each optimized for a different concentration range, to compute the concentration of the target substance based on the output from a reaction system containing the target substance and a reactant capable of reacting with the target substance. The calibration curves are prepared based on the output from a plurality of standard reaction systems each containing a standard reagent of a known different concentration and the reactant. The method can be easily and inexpensively implemented.

Problems solved by technology

However, to perform the measurement of the same analyte a plurality of times is not desirable in view of the high cost of the antigen.
Although the prozone-like phenomenon does not occur in the measurement of e.g. the glucose level in urine, such measurement suffers from another problem that measurement resolution is poor in a high concentration range.
Therefore, a system in which the prozone-like phenomenon does not occur also suffers from low measurement accuracy in a high concentration range.

Method used


Image

  • Concentration measuring method
  • Concentration measuring method
  • Concentration measuring method

Examples


first embodiment

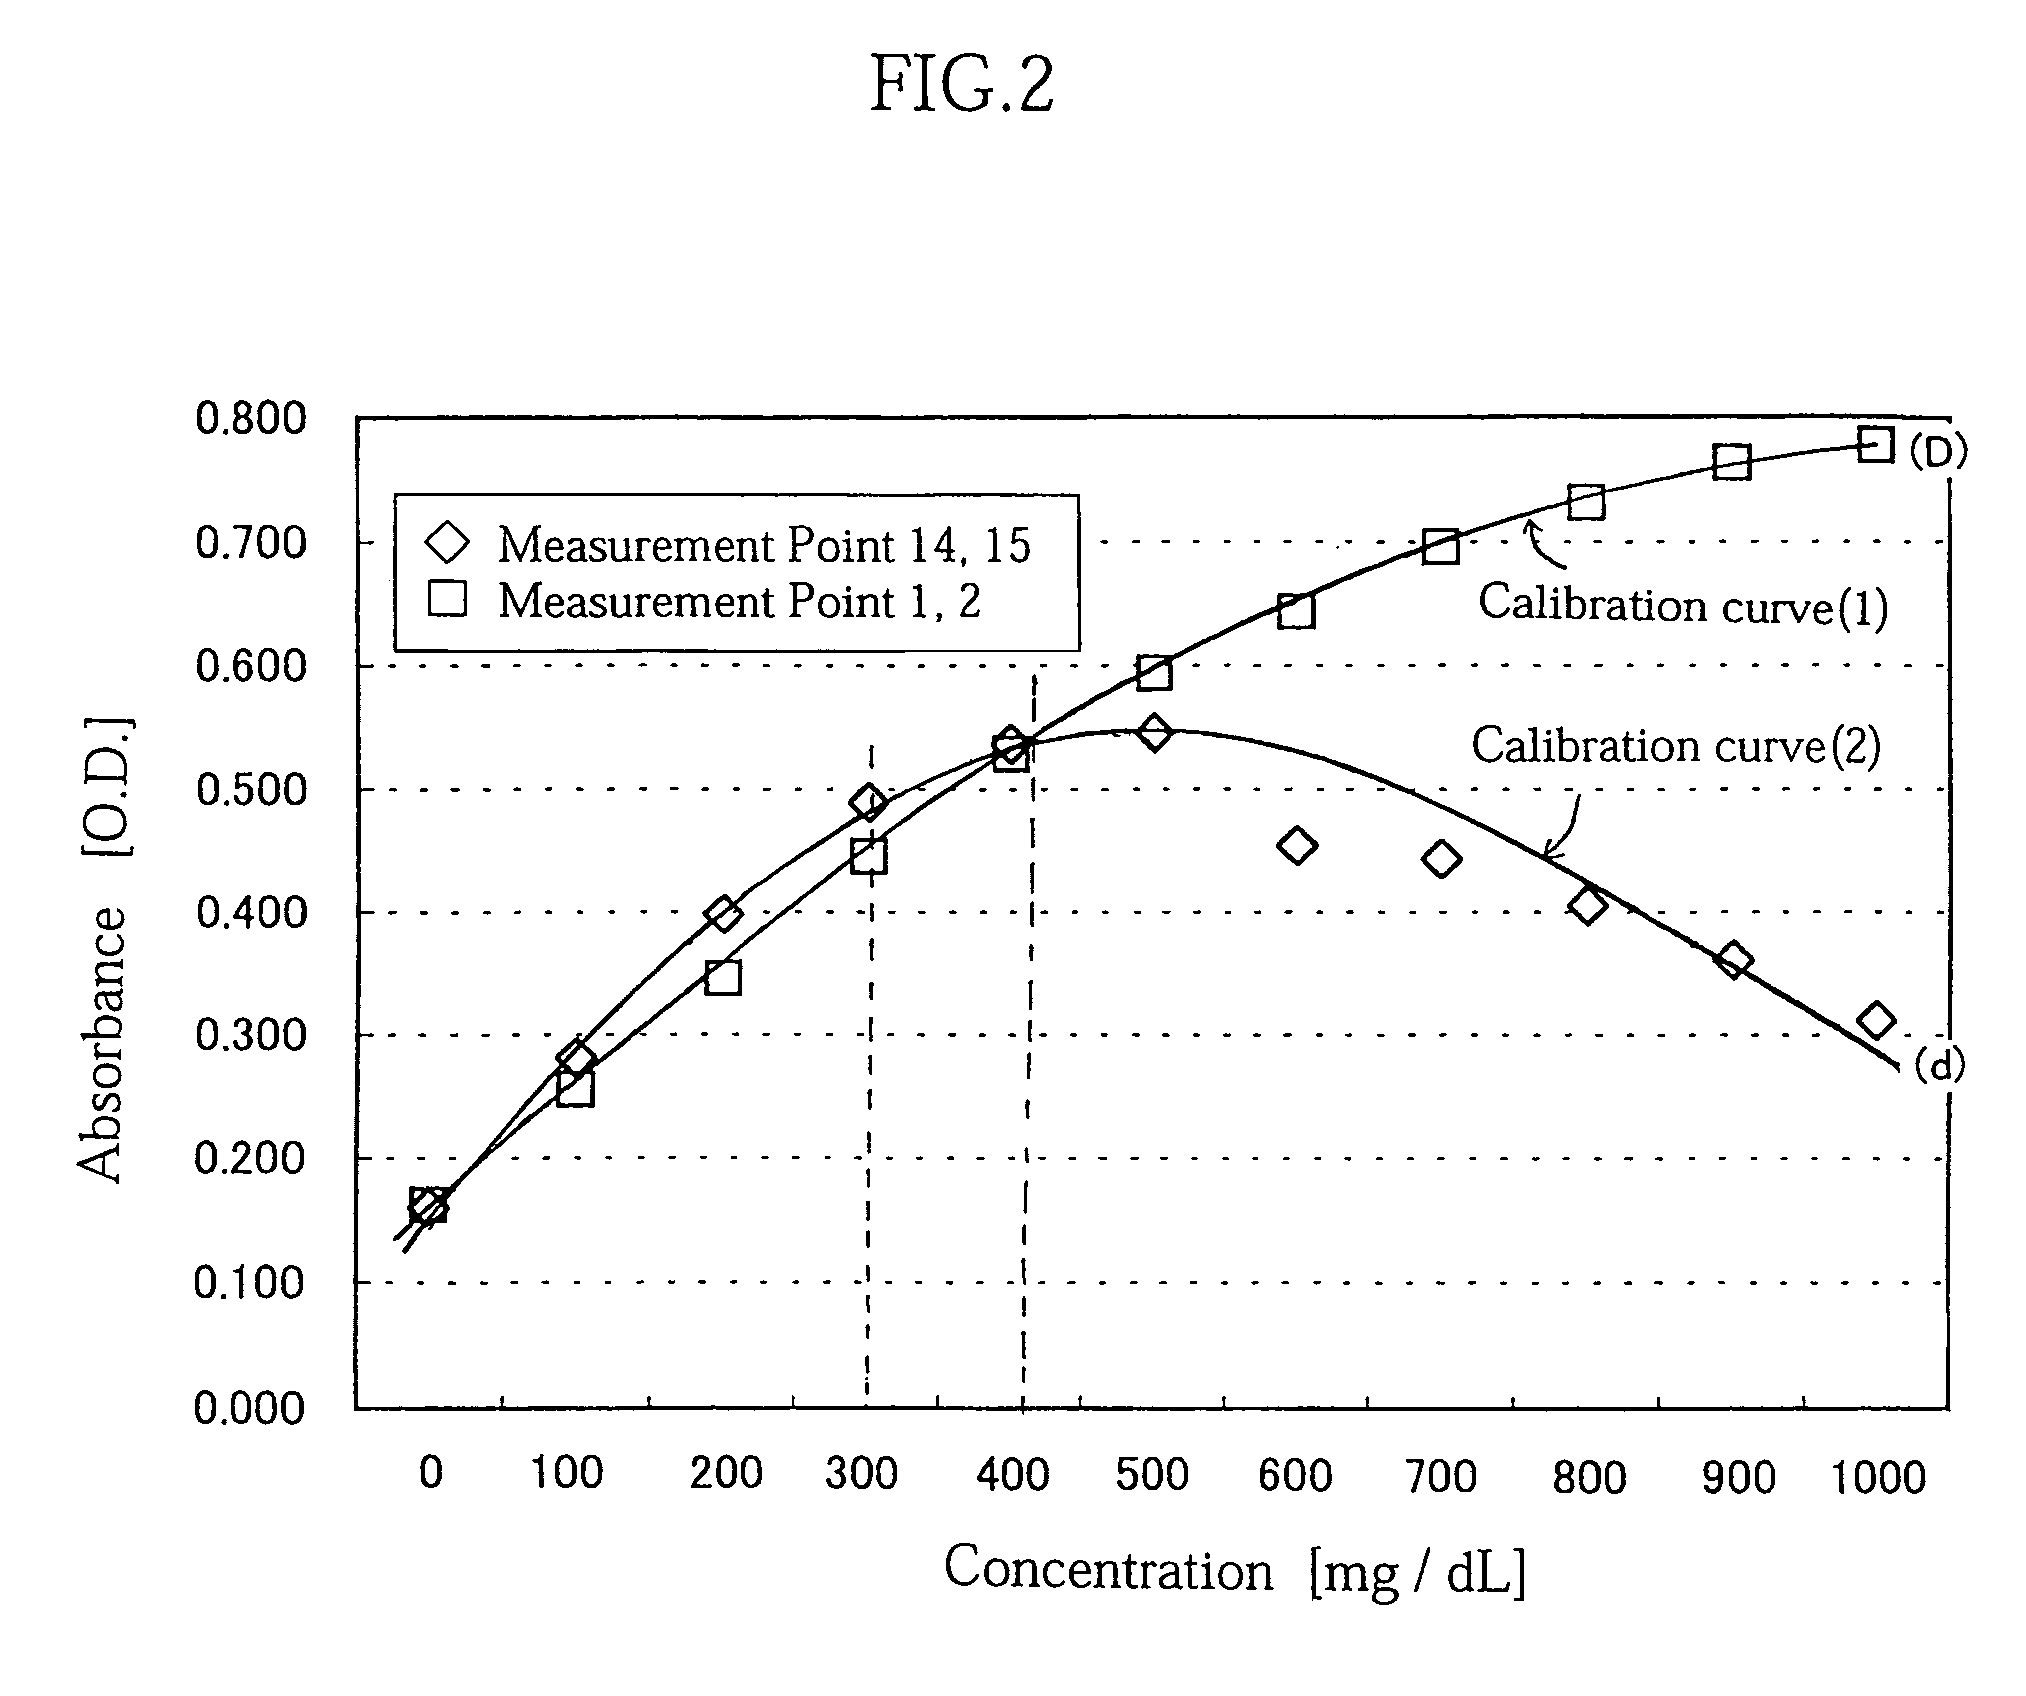
[0030]In the concentration measuring method according to the present invention, the concentration computation is performed by selectively using one calibration curve for a sample of a relatively high concentration and another calibration curve for a sample of a relatively low concentration. The specific manner for selectively using the two calibration curves (1), (2) will be described later, and the reasons for using the two calibration curves (1), (2) will be described first.

[0031]FIG. 2 shows two calibration curves (1), (2) to be utilized when the target substance is protein (human serum albumin). Specifically, these calibration curves (1), (2) may be used in measuring the protein concentration in human urine, for example.

[0032]The calibration curve (1) is prepared by using a reaction solution of a high protein concentration (1000 mg / dL) and based on the absorbance measured in the initial stage of the reaction. Herein, the “initial stage of the reaction” means a stage of reaction ...

second embodiment

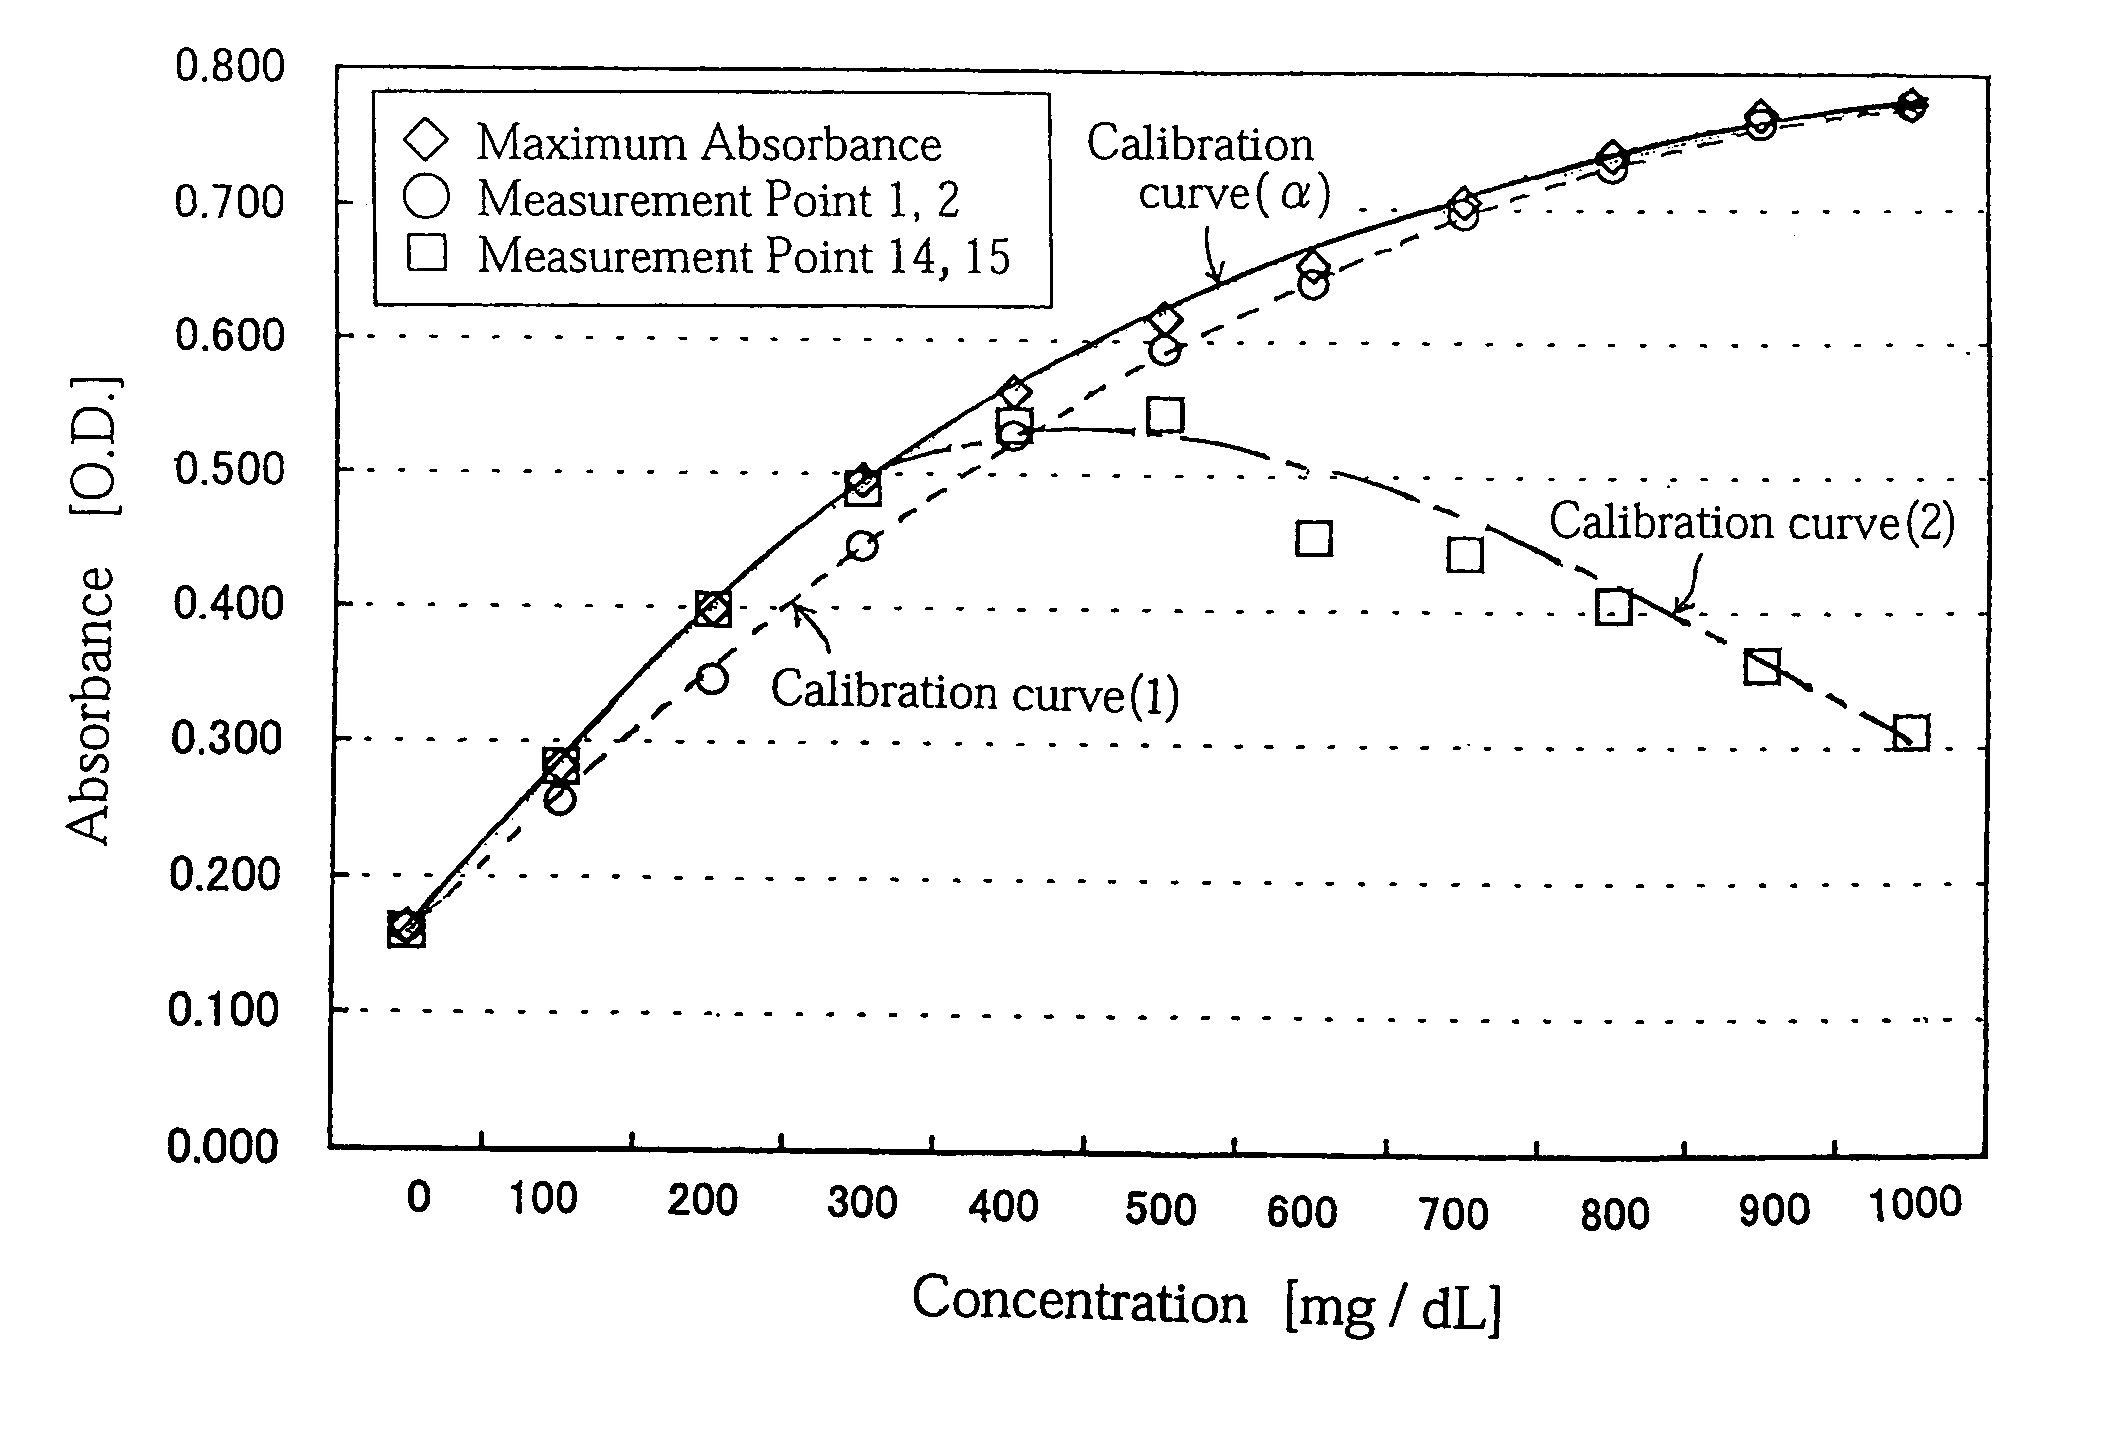
[0057]Next, a concentration measuring method according to the present invention will be described. In this concentration measuring method, a plurality of calibration curves (A)–(H) shown in FIG. 7 are selectively used for the concentration computation. The calibration curves (A)–(H) are prepared based on the plurality of absorbance measurements used in preparing the graph of FIG. 3. Specifically, the absorbance measurements are grouped for each of the measurement points, and each of the calibration curves (A)–(H) is formed to correspond to a respective group (respective measurement point). In other words, the calibration curves (A)–(H) are prepared with respect to different reaction times (a plurality of measurement points).

[0058]As shown in FIG. 8, in performing the concentration computation using the calibration curves (A)–(H), the absorbance is measured at each of the measurement points (S30). Subsequently, the one which is optimum for the concentration computation is selected fr...


PUM

PropertyMeasurementUnit
concentrationaaaaaaaaaa
concentrationsaaaaaaaaaa

Abstract

A concentration measuring method includes selecting a calibration curve optimum for computing the concentration of a measurement target substance from a plurality of calibration curves based on an output from a reaction system containing the target substance and a reactant capable of reacting with the target substance, and computing the concentration of the target substance based on the optimum calibration curve and the output. Each of the calibration curves is prepared based on a plurality of outputs generated upon lapse of a same reaction time from a plurality of standard reaction systems each containing a standard reagent of a known different concentration and the reactant. The plurality of calibration curves differ from each other in reaction time based on which the calibration curves are prepared.

Description

TECHNICAL FIELD[0001]The present invention relates to a concentration measuring method for computing the concentration of a target substance to be measured based on an output value from a reaction system containing the target substance, and a calibration curve (which shows the relationship between the concentration of the target substance and the output value).BACKGROUND ART[0002]A conventional method for measuring the concentration of an antigen in an analyte such as urine may utilize the combination of an antigen-antibody reaction and an optical technique. In this method, for instance, an analyte is mixed with an antibody for causing an antigen-antibody reaction, and the concentration is computed based on the absorbance outputted when the reaction system is irradiated with light. In this method, as long as the antigen concentration in the reaction system does not exceed a specific range, the measured absorbance with an increasing concentration of the antigen. However, when the ant...

Claims


Application Information

Patent Timeline
Patent Type & Authority Patents(United States)
IPC IPC(8): G06F19/00G01N21/27G01N21/75
CPCG01N21/272G01N21/274G01N35/00693G01N21/83G01N21/75
Inventor FUKUNAGA, SATOSHINAKAYAMA, MASATO
Owner ARKRAY INC
Learn More