
2-D and 3-D Graphical Visualization of Diversification of Portfolio Holdings

a portfolio holding and graph technology, applied in the field of risk management techniques, can solve the problems of inherently not diverse, difficult and time-consuming task of quantitatively determining how diverse a portfolio of investments is, and difficult to read and comprehend

Active Publication Date: 2015-09-24
THE VANGUARD GROUP
View PDF7 Cites 5 Cited by
  • Summary
  • Abstract
  • Description
  • Claims
  • Application Information

AI Technical Summary

Benefits of technology

The patent describes a way to visualize the diversification of an investment portfolio by showing the weight of each holding in relation to the overall market. This helps to show how well the investment is spread across the market and reduces the risk of losing money from individual holdings. The visualization can show both 2D and 3D views, with different levels of detail. This invention helps investors to better understand the diversification of their investments and take appropriate measures to minimize risks.

Problems solved by technology

However, most mutual funds focus on very specific market segments (e.g., large cap stocks, small cap stocks, value stocks, growth stocks, real estate), and thus are inherently not diverse in certain aspects.
It is a very difficult and time-consuming task to quantitatively determine how diverse a portfolio of investments is.
Oftentimes, this type of information is communicated to users in formats that are difficult to read and comprehend.

Method used


Image

  • 2-D and 3-D Graphical Visualization of Diversification of Portfolio Holdings
  • 2-D and 3-D Graphical Visualization of Diversification of Portfolio Holdings
  • 2-D and 3-D Graphical Visualization of Diversification of Portfolio Holdings

Examples


Embodiment Construction

[0021]Certain terminology is used herein for convenience only and is not to be taken as a limitation on the present invention. Various Vanguard funds are referred to throughout the specification. These funds are merely exemplary funds for illustrating preferred embodiments of the present invention. The present invention is not limited to using Vanguard funds.

I. Acronyms / Abbreviations

CRSP: Center for Research in Security Prices

FTSE: Financial Times Stock Exchange

II. 2D Visual Representations

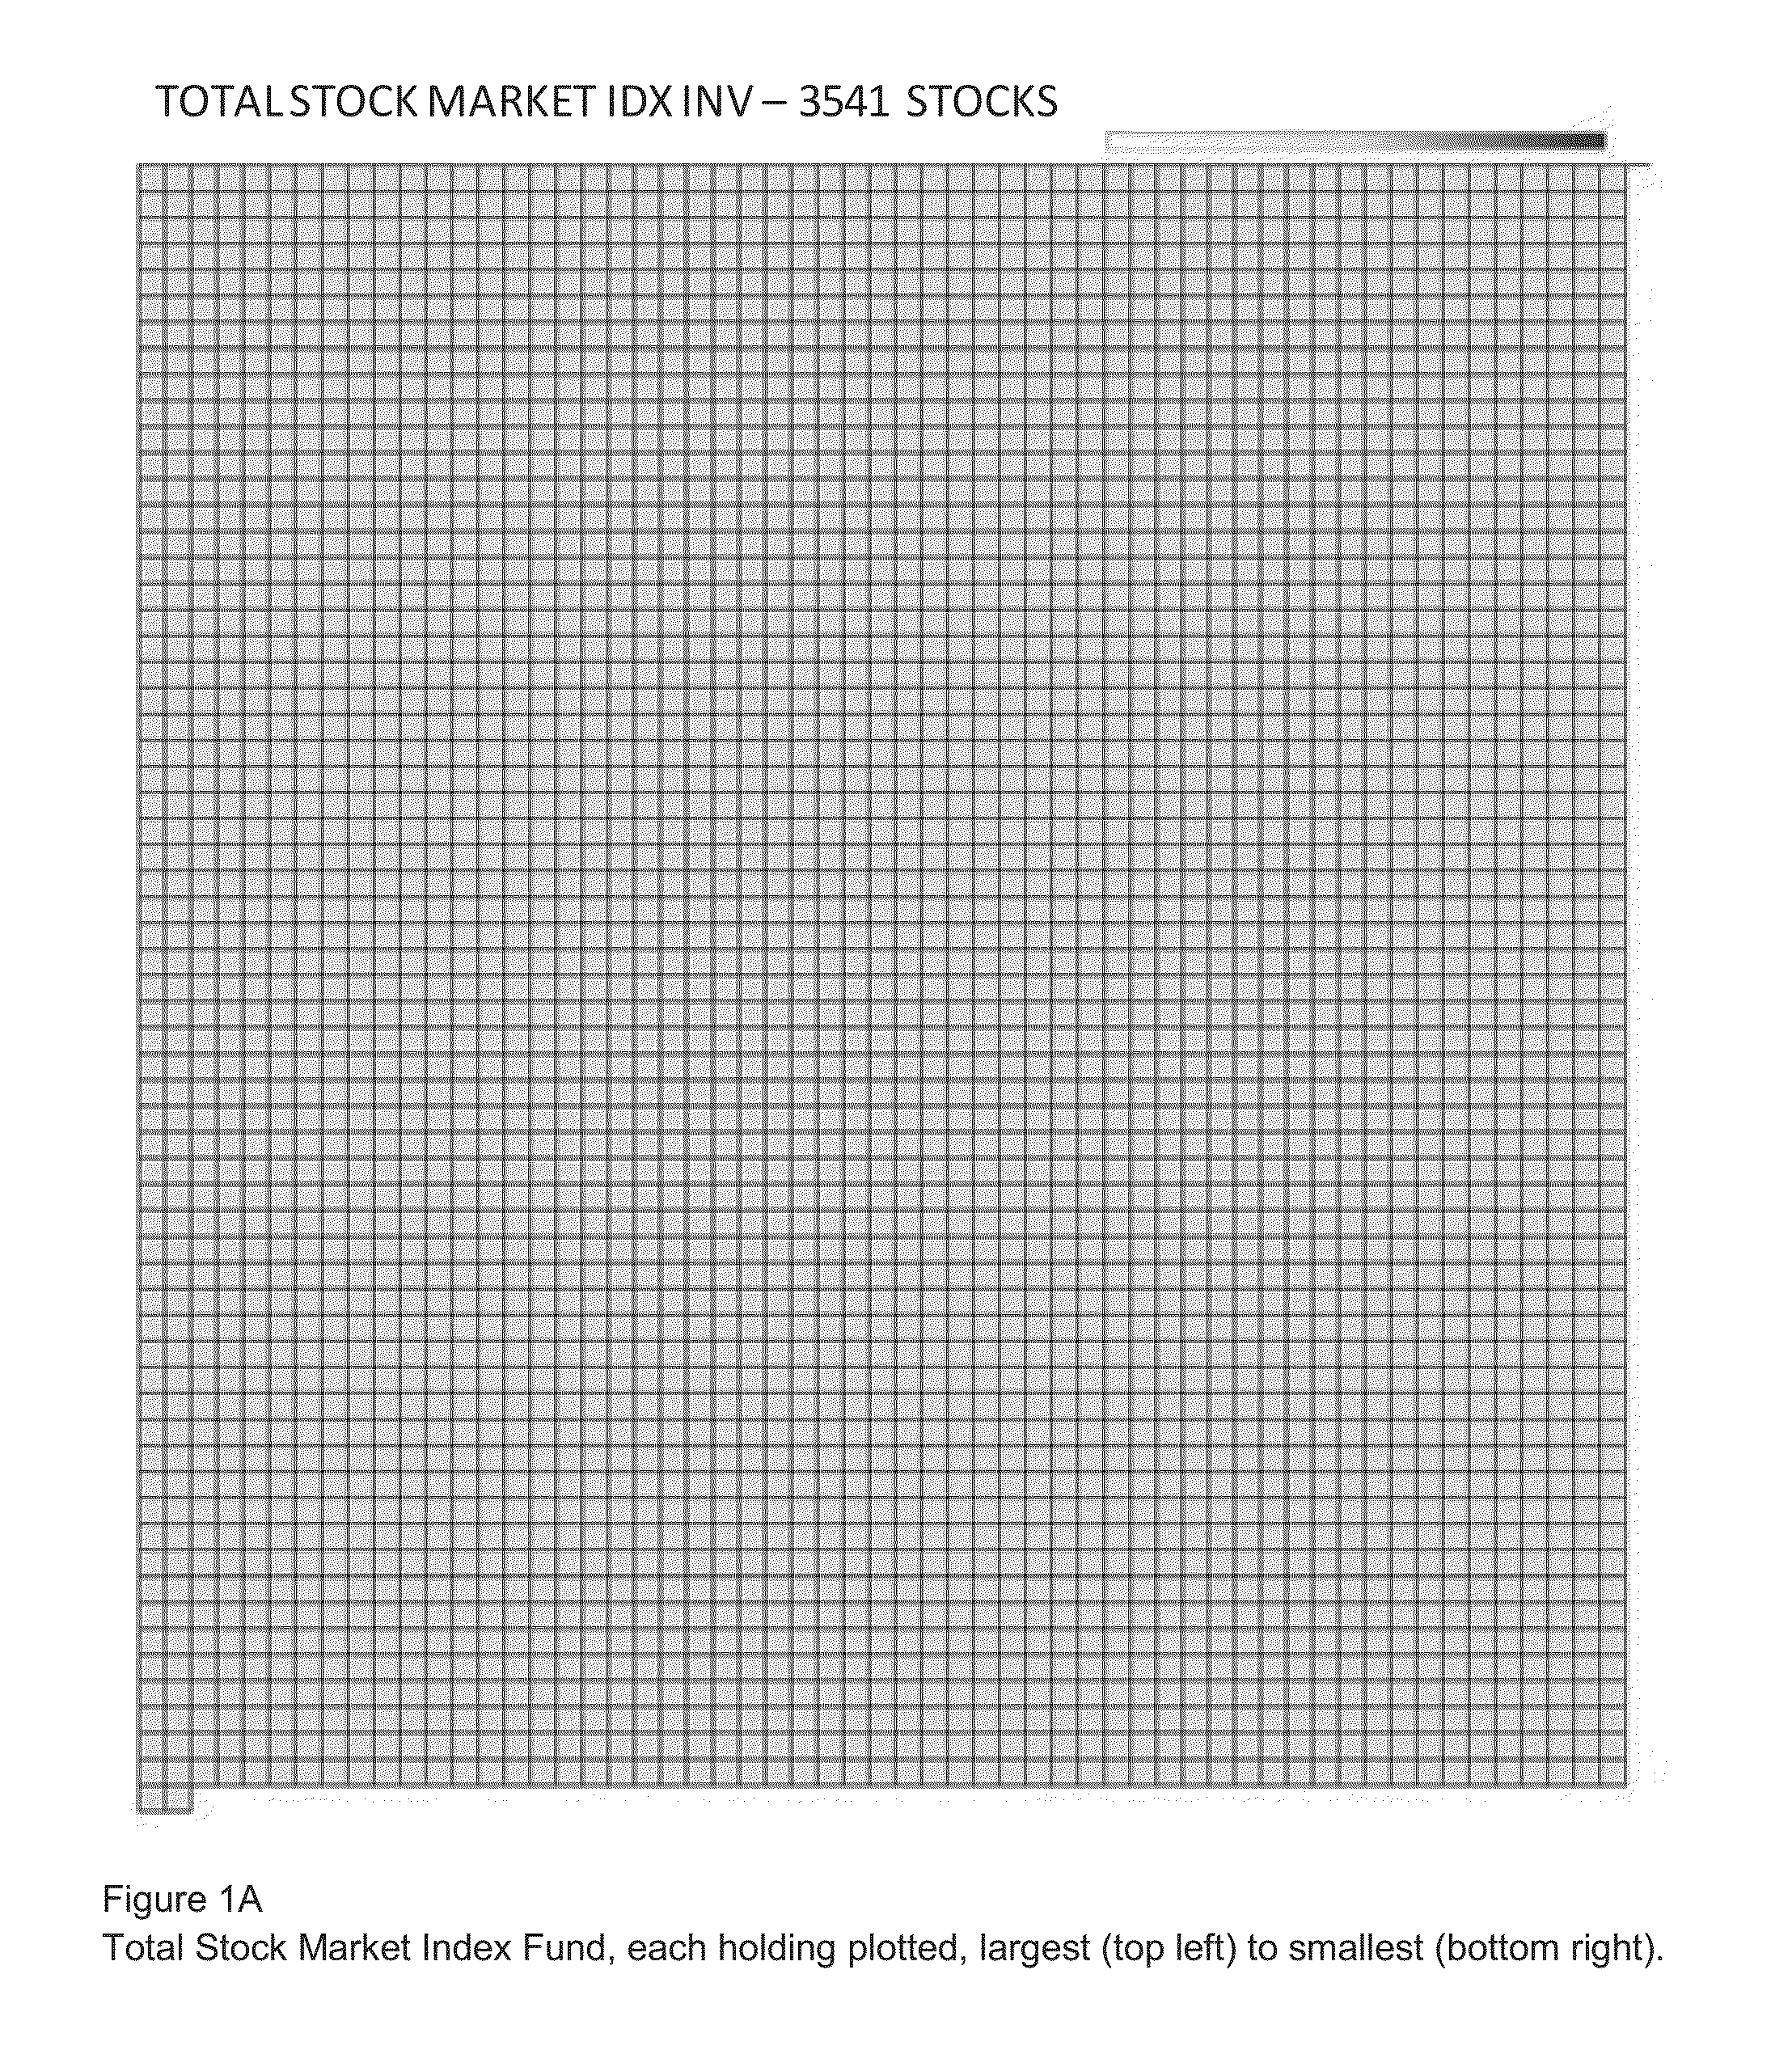
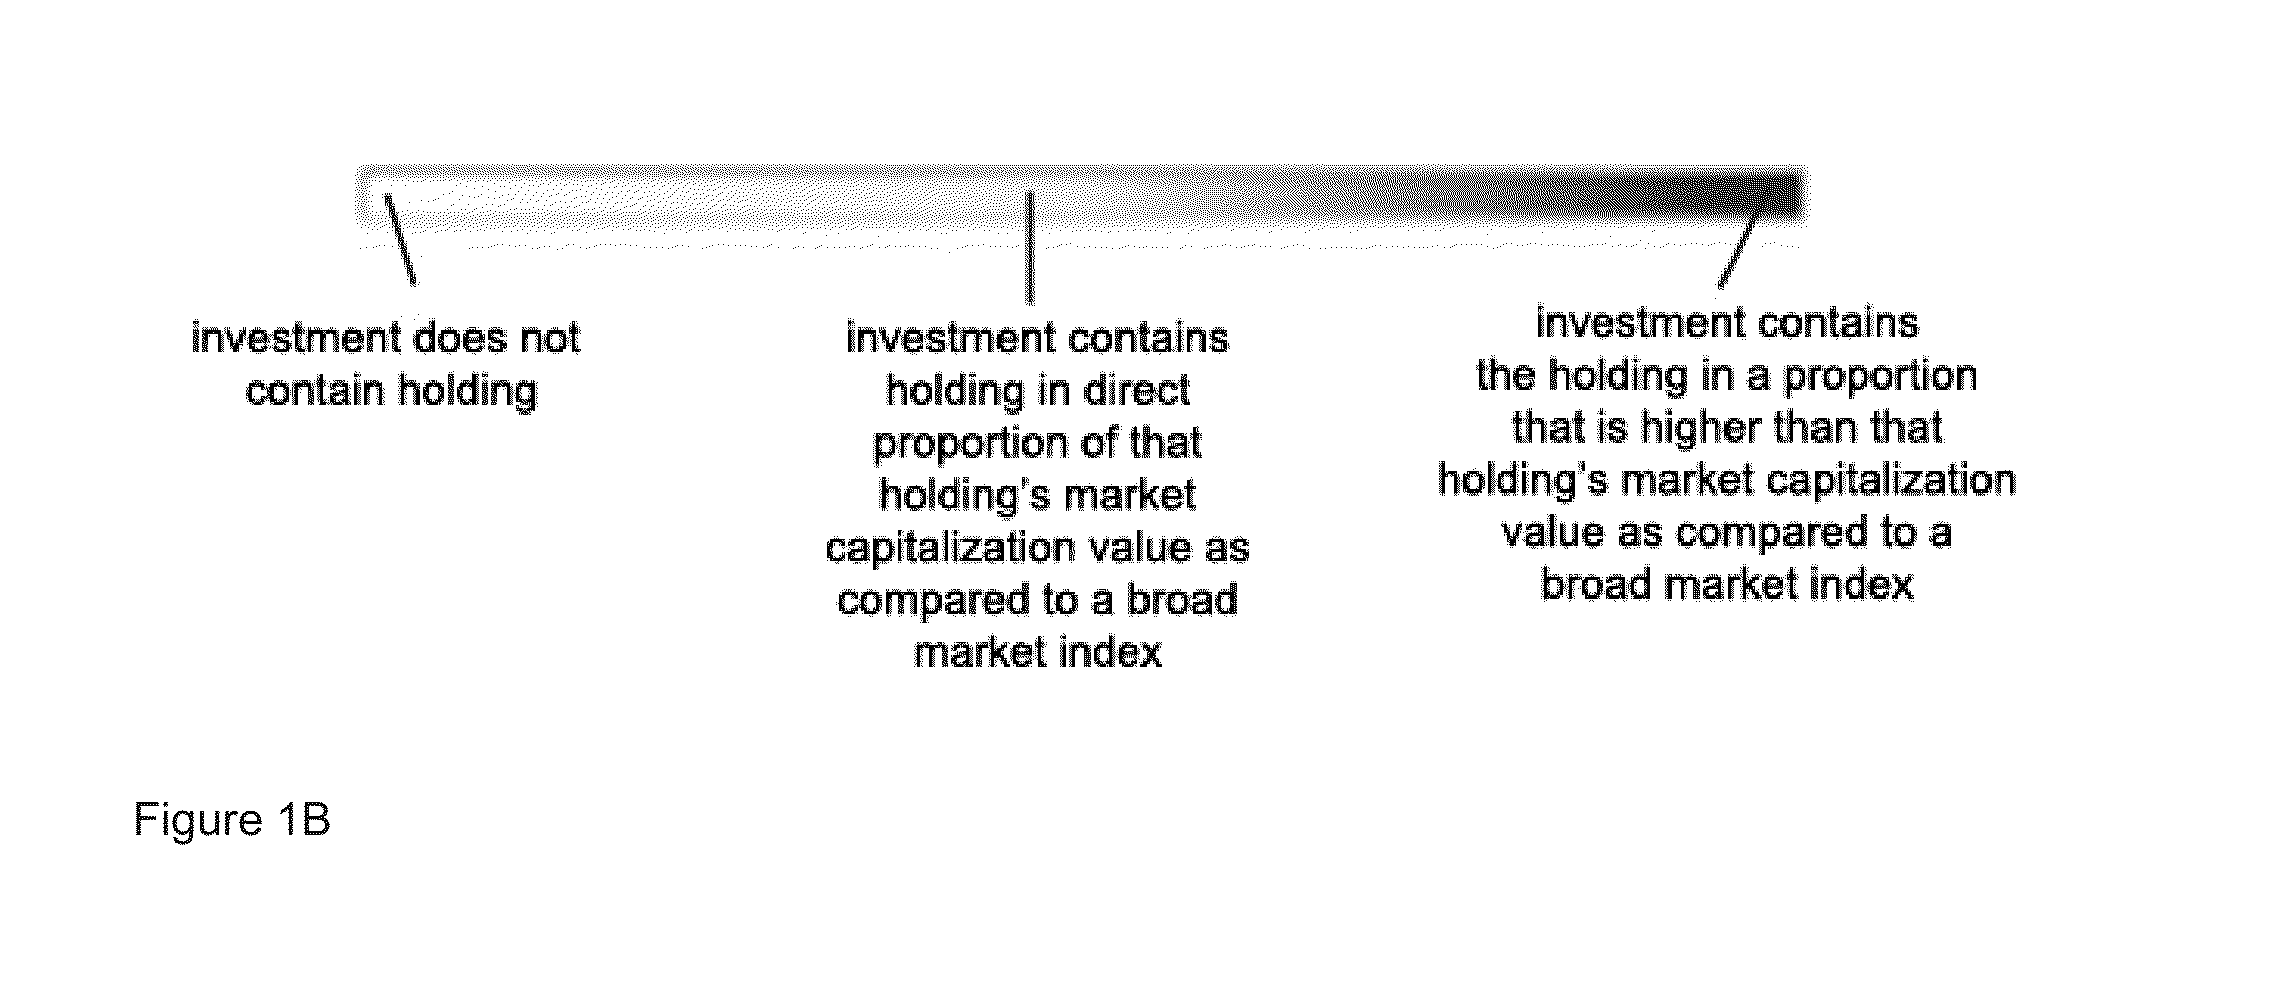
[0022]The degree of diversification can vary greatly between different investments (e.g., mutual funds). As an example, the Vanguard Total Stock Market fund (FIG. 1A) provides nearly 100% coverage of the U.S. stock market. FIG. 1A depicts this coverage by showing that nearly every unit (each unit in the grid represents a company of the US Stock Market) is shaded (indicating that the fund contains that particular holding) and that the fund owns each holding in the same proportion as it is valued in...


PUM


Abstract

Data visualization processes are provided for expressing diversification of an investment based on each underlying holding weight in the investment relative to each holding's market capitalization weight in the investment and each holding's market capitalization weight in the broad market or by its absolute holding percentage. Visualizations can be depicted in both 2-D and 3-D formats, with area fill, volume fill, color, and / or opacity depicting percentage of coverage. Visualization can show diversification down to the individual holding level and in aggregate levels, such as mega-cap, mid-cap and small-cap.

Description

BACKGROUND OF THE INVENTION[0001]Diversification is a risk management technique that mixes a wide variety of investments within a portfolio. A portfolio of different kinds of investments will, on average, yield higher returns and pose a lower risk than any individual investment found within the portfolio. Stated simply, diversification is a key aspect to maximizing long-term returns on investments. Investing in mutual funds automatically ensures some level of diversification, as opposed to selecting and holding a few individual securities, because a mutual fund typically holds a large number of securities. However, most mutual funds focus on very specific market segments (e.g., large cap stocks, small cap stocks, value stocks, growth stocks, real estate), and thus are inherently not diverse in certain aspects. There are some mutual funds that attempt to mimic the broad market, such as the Vanguard Total Stock Market Index fund, and thus inherently provide a high degree of diversific...

Claims


Application Information

Patent Timeline
Patent Type & Authority Applications(United States)
IPC IPC(8): G06Q40/06
CPCG06Q40/06
Inventor PADILLA, MICHAEL R.BUHL, JOHN E.
Owner THE VANGUARD GROUP
Learn More