
Similarity index: a rapid classification method for multivariate data arrays

a multi-variate data and similarity index technology, applied in the field of quantitative and qualitative analysis of materials or chemicals, can solve the problems of complex aqueous based mixture analysis, time-consuming, difficult and time-consuming, and require deep mathematical knowledge and expertise, and achieve the effect of rapid analysis of complex data sets

Inactive Publication Date: 2009-12-10
THE NAT UNIV OF IRELAND GALWAY
View PDF5 Cites 28 Cited by
  • Summary
  • Abstract
  • Description
  • Claims
  • Application Information

AI Technical Summary

Benefits of technology

The present invention provides a method for quickly analyzing and classifying multivariate data sets. The method involves comparing the data sets and measuring the similarity between them. This similarity is determined by calculating the magnitude of an additive and subtractive combination of the data matrices, and introducing a penalty parameter to set a detectable limit of variance between the data sets. The method can be used with various types of multivariate data, such as spectroscopic, chromatographic, or imaging data. The technical effect of the invention is to provide a fast and efficient way to analyze and classify multivariate data sets.

Problems solved by technology

The analysis of complex aqueous based mixtures such as cell culture media, fermentation broths, wastewater, river / sea water etc. is often difficult when the compositional differences between samples are very small.
A key challenge therefore is the rapid characterization of compositional changes, in the gross sense and for specific analytes.
However, in many cases the differences in the spectra are very small and assessing these small changes in the topography of multidimensional spectra can be difficult and time-consuming.
However, these methods require a deep mathematical knowledge and expertise to undertake the complex procedures involved.
This can in turn hinder the capability of an analyst to faithfully conduct these methods using large amounts of data.
However, sometimes the MatrixCC method fails to describe / identify differences of interest in complex mixtures where the concentration of the individual constituents can vary significantly.
In other words, the sensitivity of the MatrixCC method may not be sufficient for complex mixture analysis.
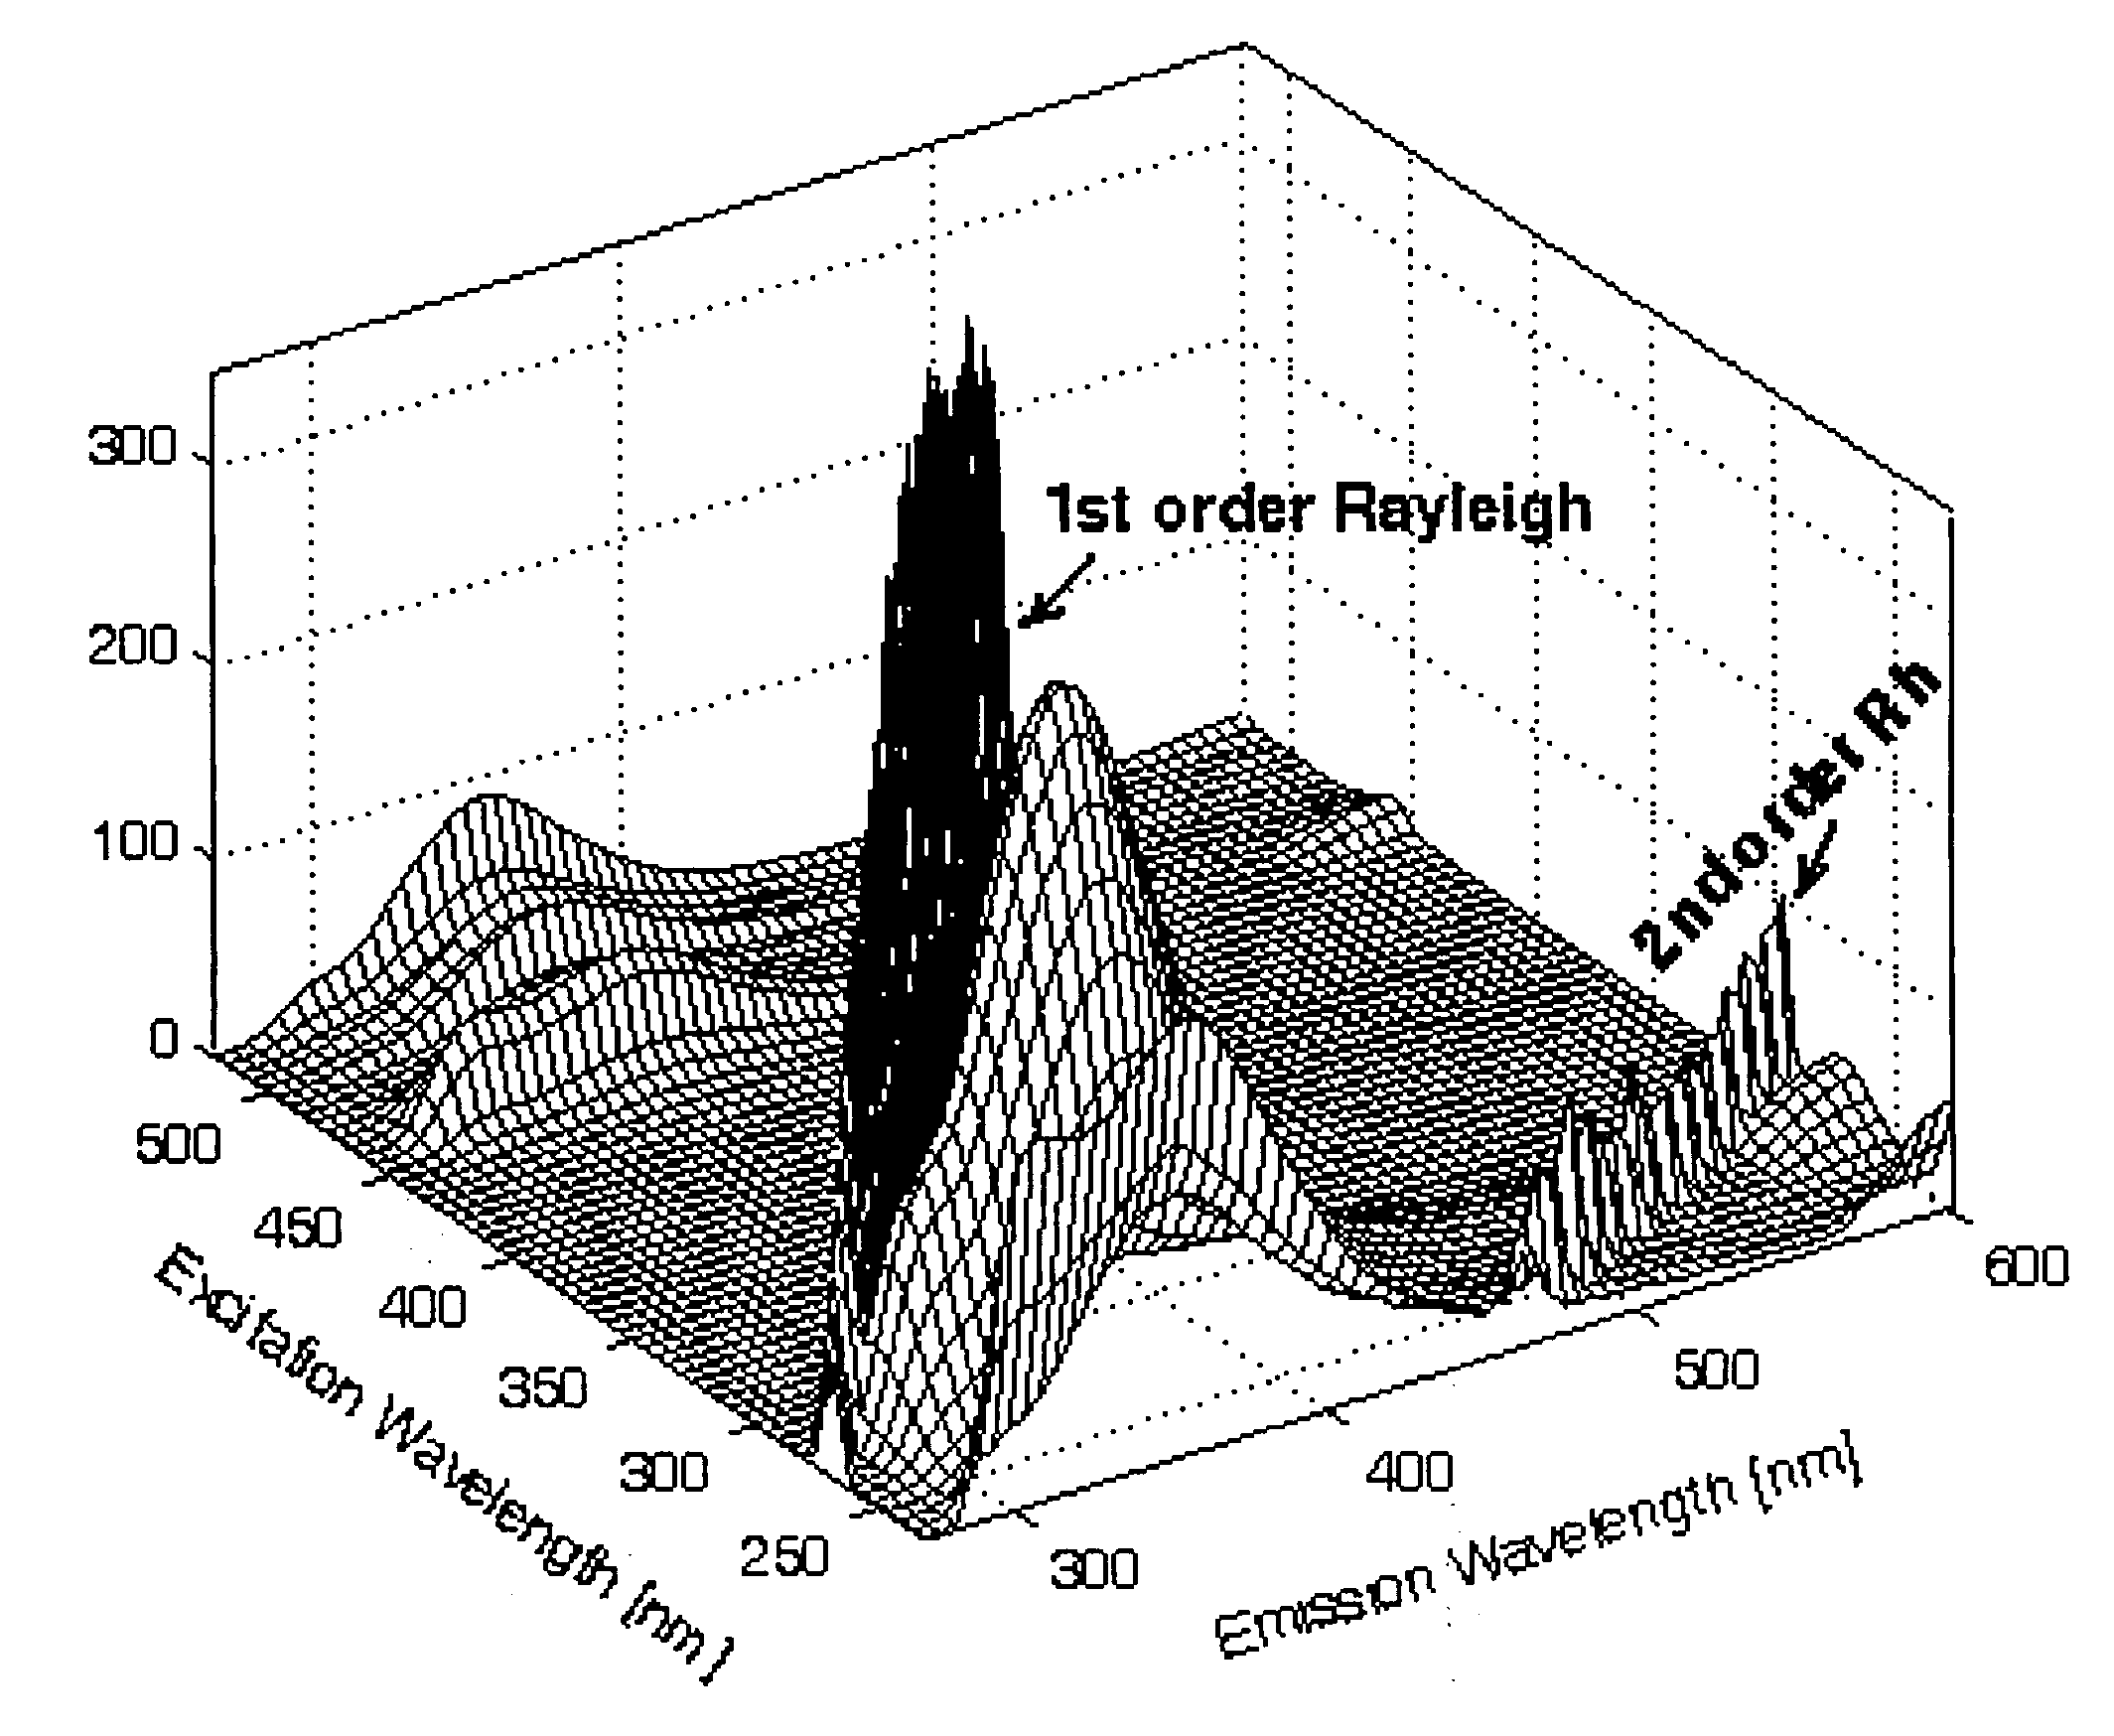
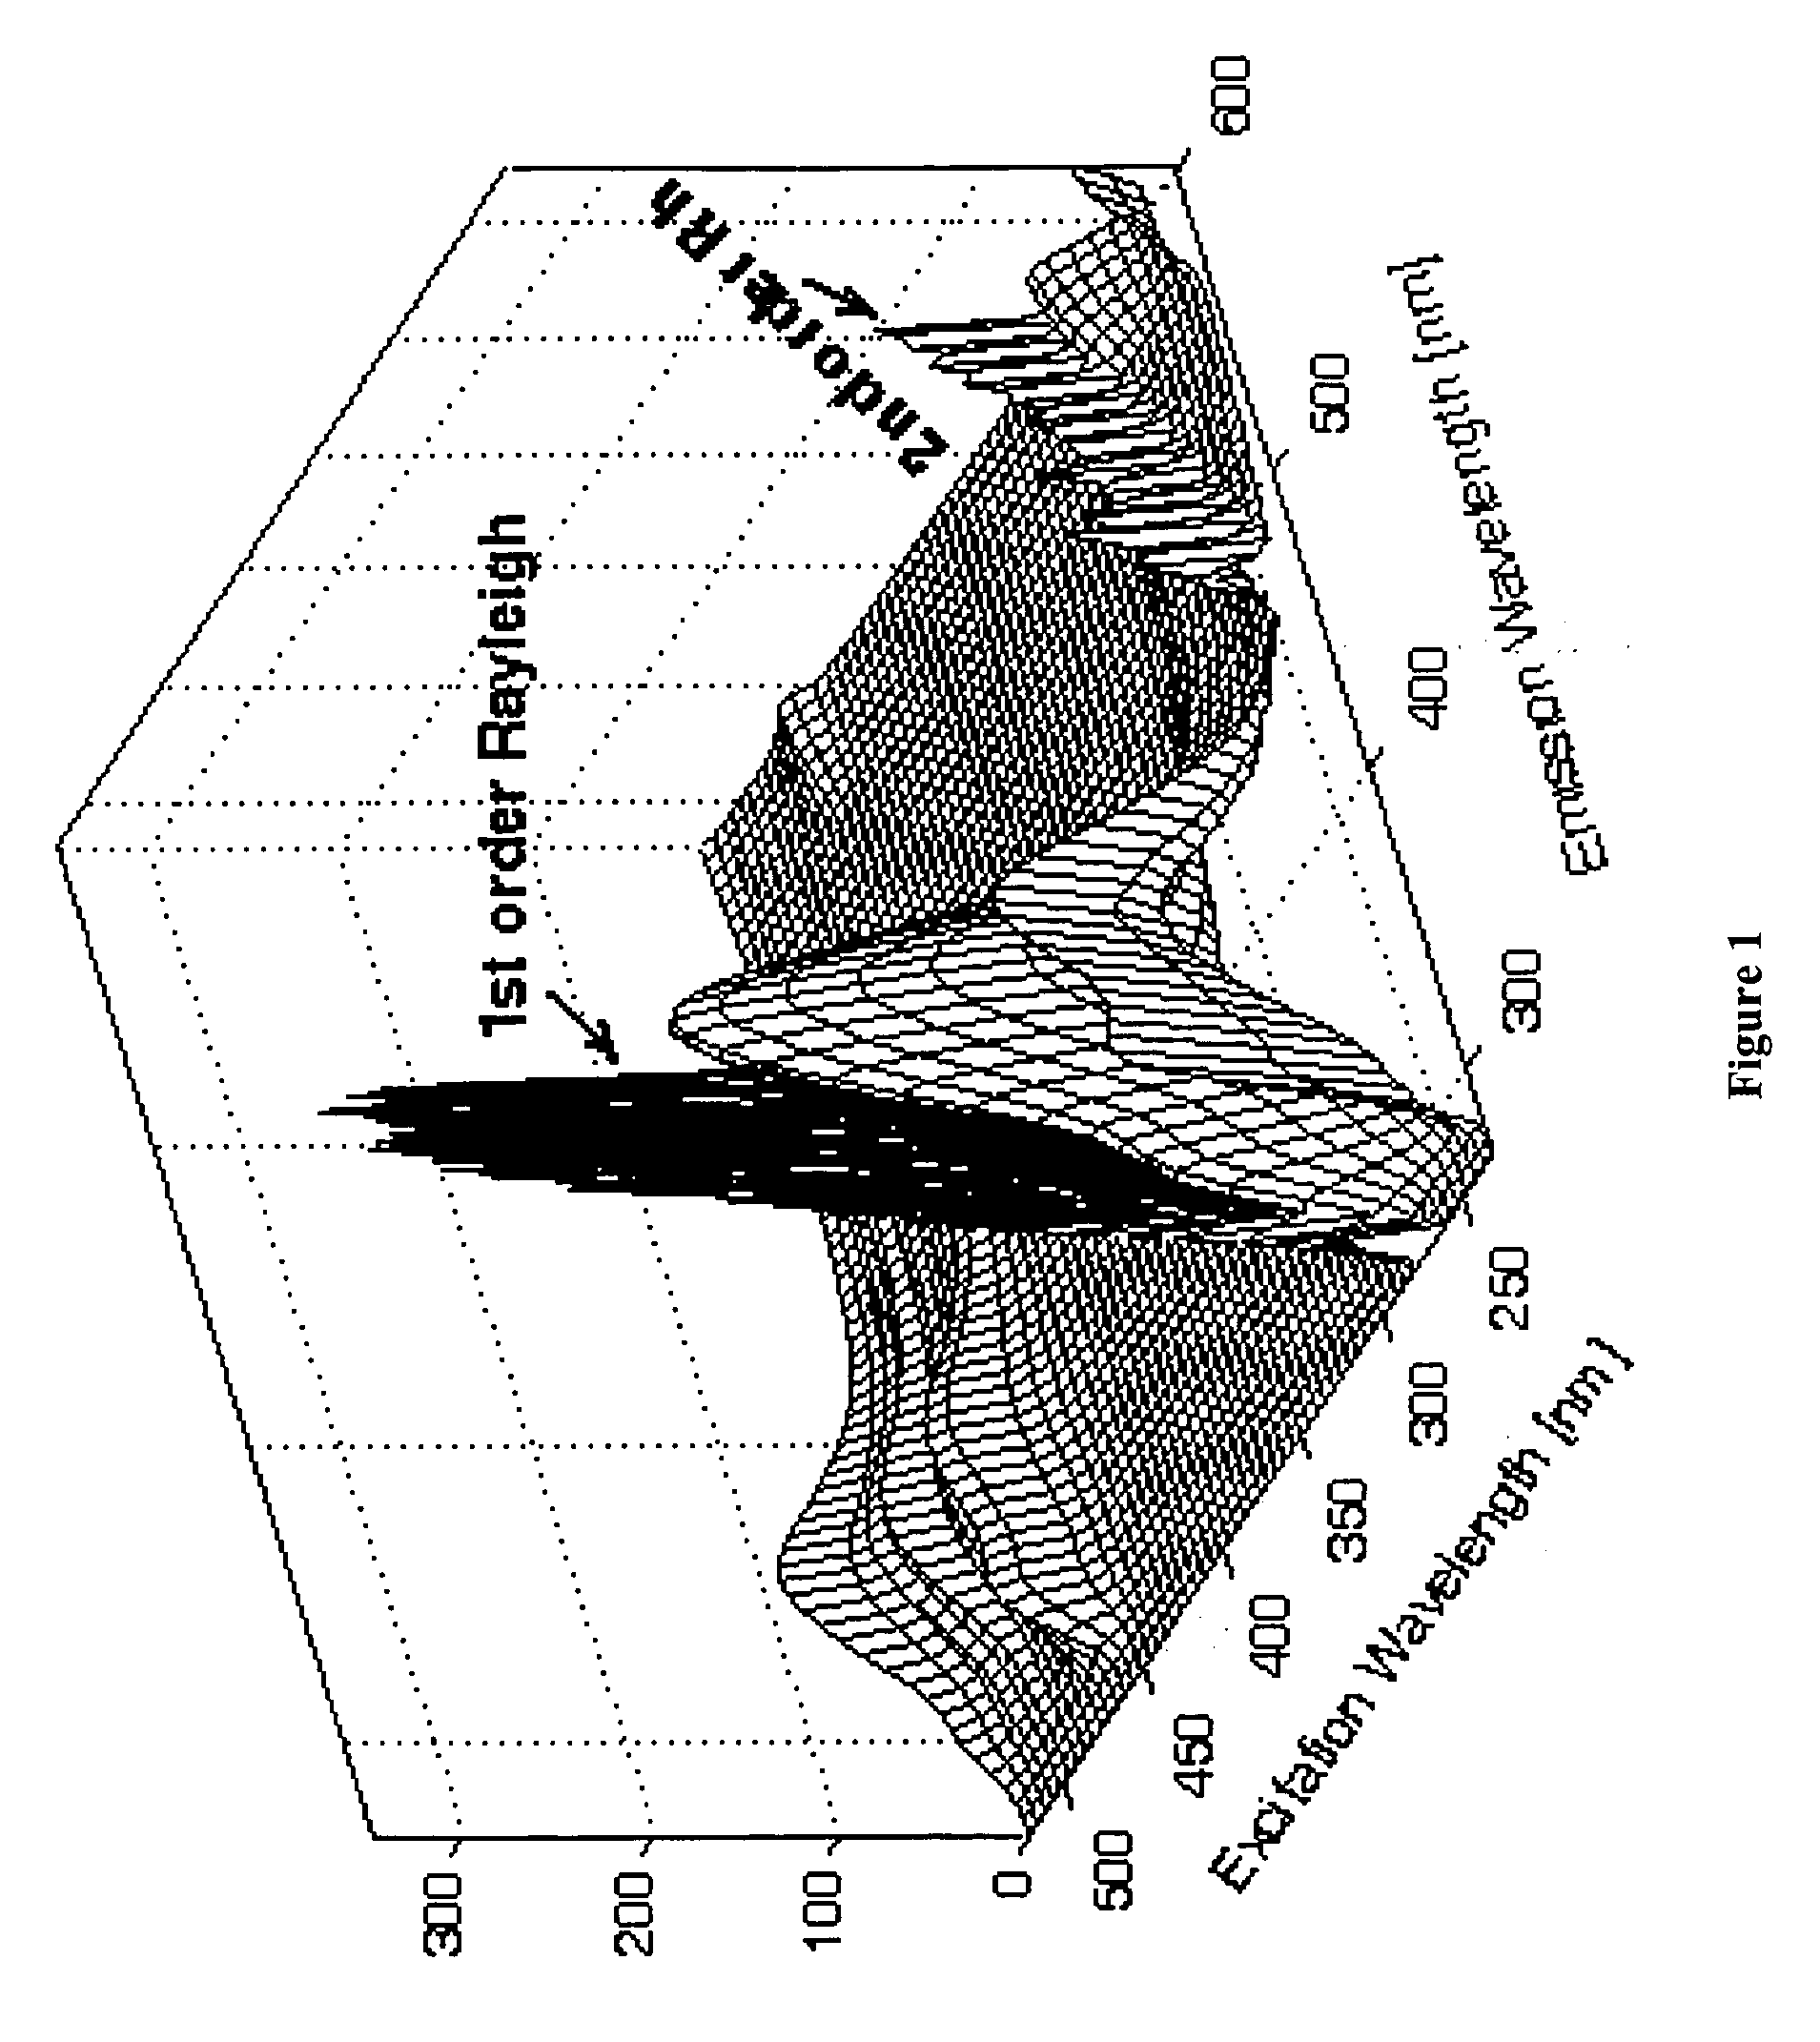
However, in practice, the data arrays are usually contaminated by noise and other factors (e.g. Rayleigh scattering in fluorescence spectroscopy) which induce deviations from the trilinear prerequisite for PARAFAC.
As a result of the presence of deviations in the spectral data, the PARAFAC model becomes less precise (it no longer yields a unique solution), and this may generate misleading estimated parameters (the spectral and concentration profiles).
For the data arrays of which D(A, B, C)≠0, it is not usually possible for PARAFAC to directly estimate a reliable solution to the model parameters unless some pretreatments are used beforehand.

Method used


Image

  • Similarity index: a rapid classification method for multivariate data arrays
  • Similarity index: a rapid classification method for multivariate data arrays
  • Similarity index: a rapid classification method for multivariate data arrays

Examples


case study 1

[0068] The secondary stock solution was diluted by Millipore water to produce a 1.375×10⁻⁶ M working solution of HPTS in phosphate buffer, whose pH was 7.6. Of this working solution, forty-nine separate measurements were made for the EEM and TSFS data collection over thirteen days. HPTS is a fluorophore whose emission properties are very sensitive to changes in acidity (pH value), hence the need for a buffered solution.

case study 2

[0069] A series of HPTS solutions in phosphate buffer at ten different concentration levels were prepared by diluting the secondary stock solution with Millipore water. They are summarized in Tables 1A-1B.

case study 3

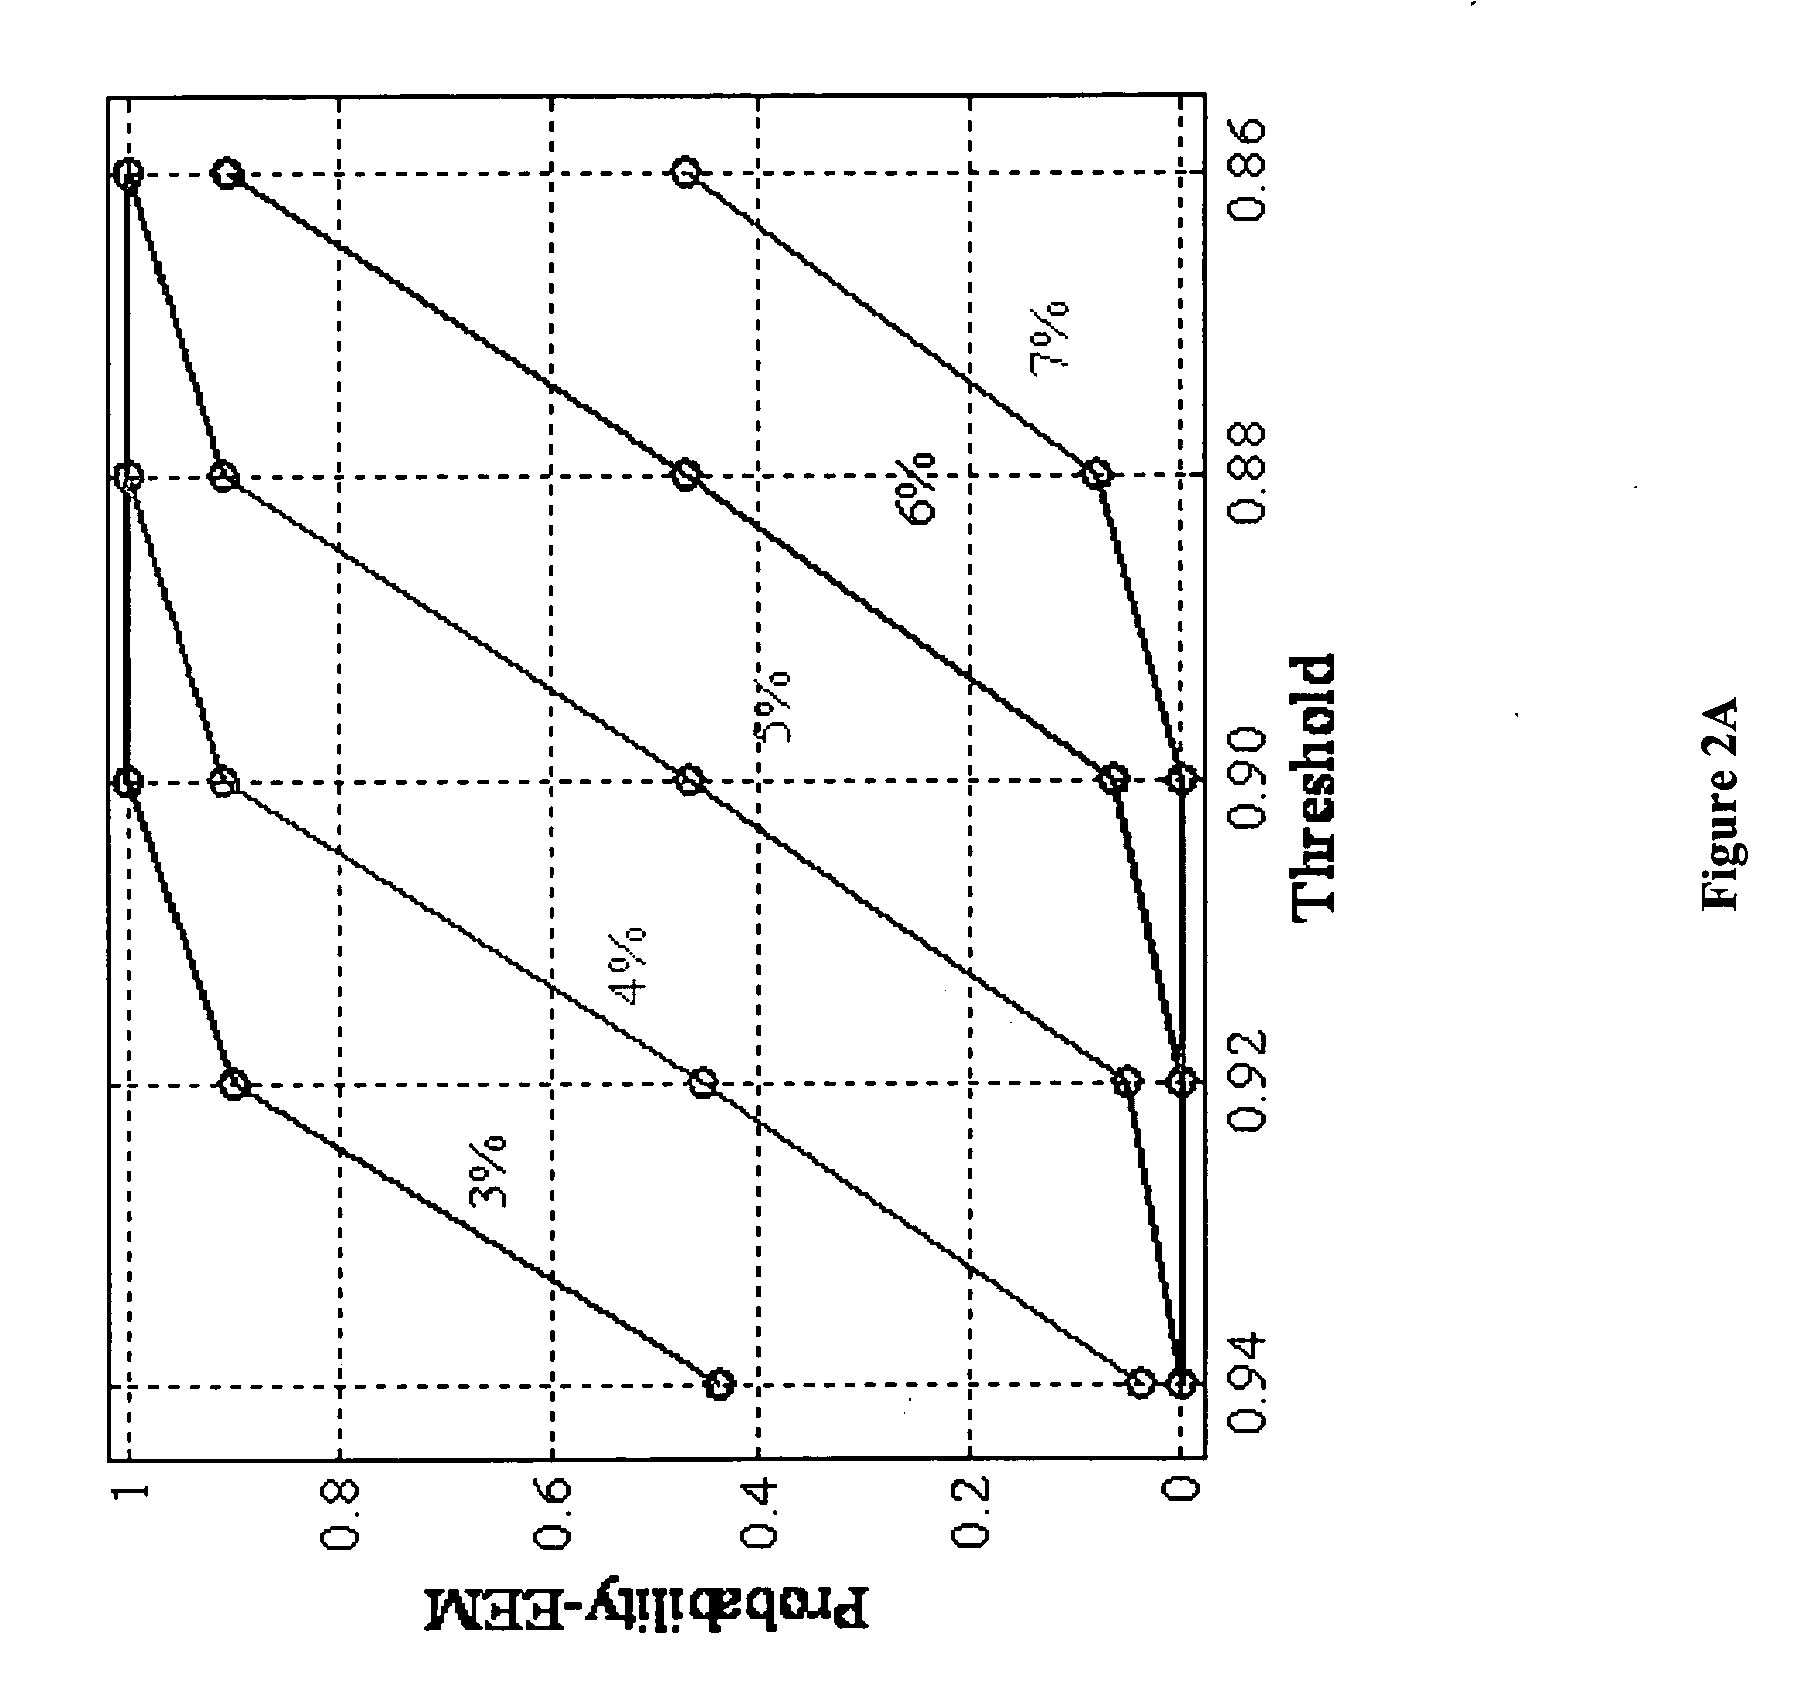
[0070] Forty-five EEM spectra of a 1.375×10⁻⁶ M working solution of HPTS in phosphate buffer measured over twelve days as in Case study 1 were utilized as a set of seeds. A variation amounting to 3.0, 4.0, 5.0, 6.0, and 7.0% of the fluorescence intensity was individually forced on these seeds to generate five EEM simulation scenarios. For each of these five scenarios, zero-mean Gaussian noise with 0.2% standard deviation (or uncertainty) was randomly augmented into 1800 simulated EEM data. In such a way, another five TSFS simulation scenarios were also generated.


PUM


Abstract

Similarity Index: a rapid classification method for multivariate data arrays The present invention is directed to a method of determining the similarity between a first multivariate data set and a second multivariate data set. The method is versatile and can be applied to a number of different multivariate data sets, for example, a spectroscopy multivariate data set. In particular, the method may be applied to rapidly assess the similarity between fluorescence spectroscopy multivariate data sets. The method comprises the steps of representing the data of a first and a second multivariate data set in matrix form to yield a multivariate data matrix, wherein each multivariate data matrix has the same dimensions. Subsequently, the magnitude of an additive and subtractive combination of each multivariate data matrix is calculated. The concept of a penalty parameter is introduced to set a detectable limit of variance between said first multivariate data set and said second multivariate data set. The penalty parameter is ascribed a value and is used in combination with the magnitude of an additive and subtractive combination of each multivariate data matrix to determine a similarity value. The determined similarity value indicates the variance between said first multivariate data set and said second multivariate data set.

Description

FIELD OF THE INVENTION[0001]The present invention relates to the quantitative and qualitative analysis of materials or chemicals based on comparing the similarity of multivariate data sets that are generated by spectroscopic, chromatographic, or imaging means.BACKGROUND TO THE INVENTION[0002]As used herein, boldface capitals designate two-dimensional data matrices (e.g., Xi×j) and underlined boldface capitals symbolize three-way arrays (e.g., XI×J×K). Vectors are represented by bold lowercase characters, scalars or elements of matrices by lowercase italics. The superscript T denotes the matrix or vector transposition. ∥X∥p indicates the Entrywise p-norm of matrix X, where p≧1.[0003]The analysis of complex aqueous based mixtures such as cell culture media, fermentation broths, wastewater, river / sea water etc. is often difficult when the compositional differences between samples are very small. For example, cell culture broth is an enormously complex mixture consisting of a vast varie...

Claims


Application Information

Patent Timeline
Patent Type & Authority Applications(United States)
IPC IPC(8): G06F17/18
CPCG01N21/35G01N21/359G01N21/64G01N21/3577G01N2201/1293G06K9/6215G01N21/65G06F18/22
Inventor LI, BOYANRYDER, ALAN G.
Owner THE NAT UNIV OF IRELAND GALWAY
Learn More