
Medical practice pattern tool

a pattern tool and medical technology, applied in the field of computer-implemented processes for the analysis of medical practice, can solve the problems of not taking the necessary steps, and affecting the quality of medical car

Inactive Publication Date: 2007-05-10
FOCUSED MEDICAL ANALYTICS
View PDF46 Cites 57 Cited by
  • Summary
  • Abstract
  • Description
  • Claims
  • Application Information

AI Technical Summary

Benefits of technology

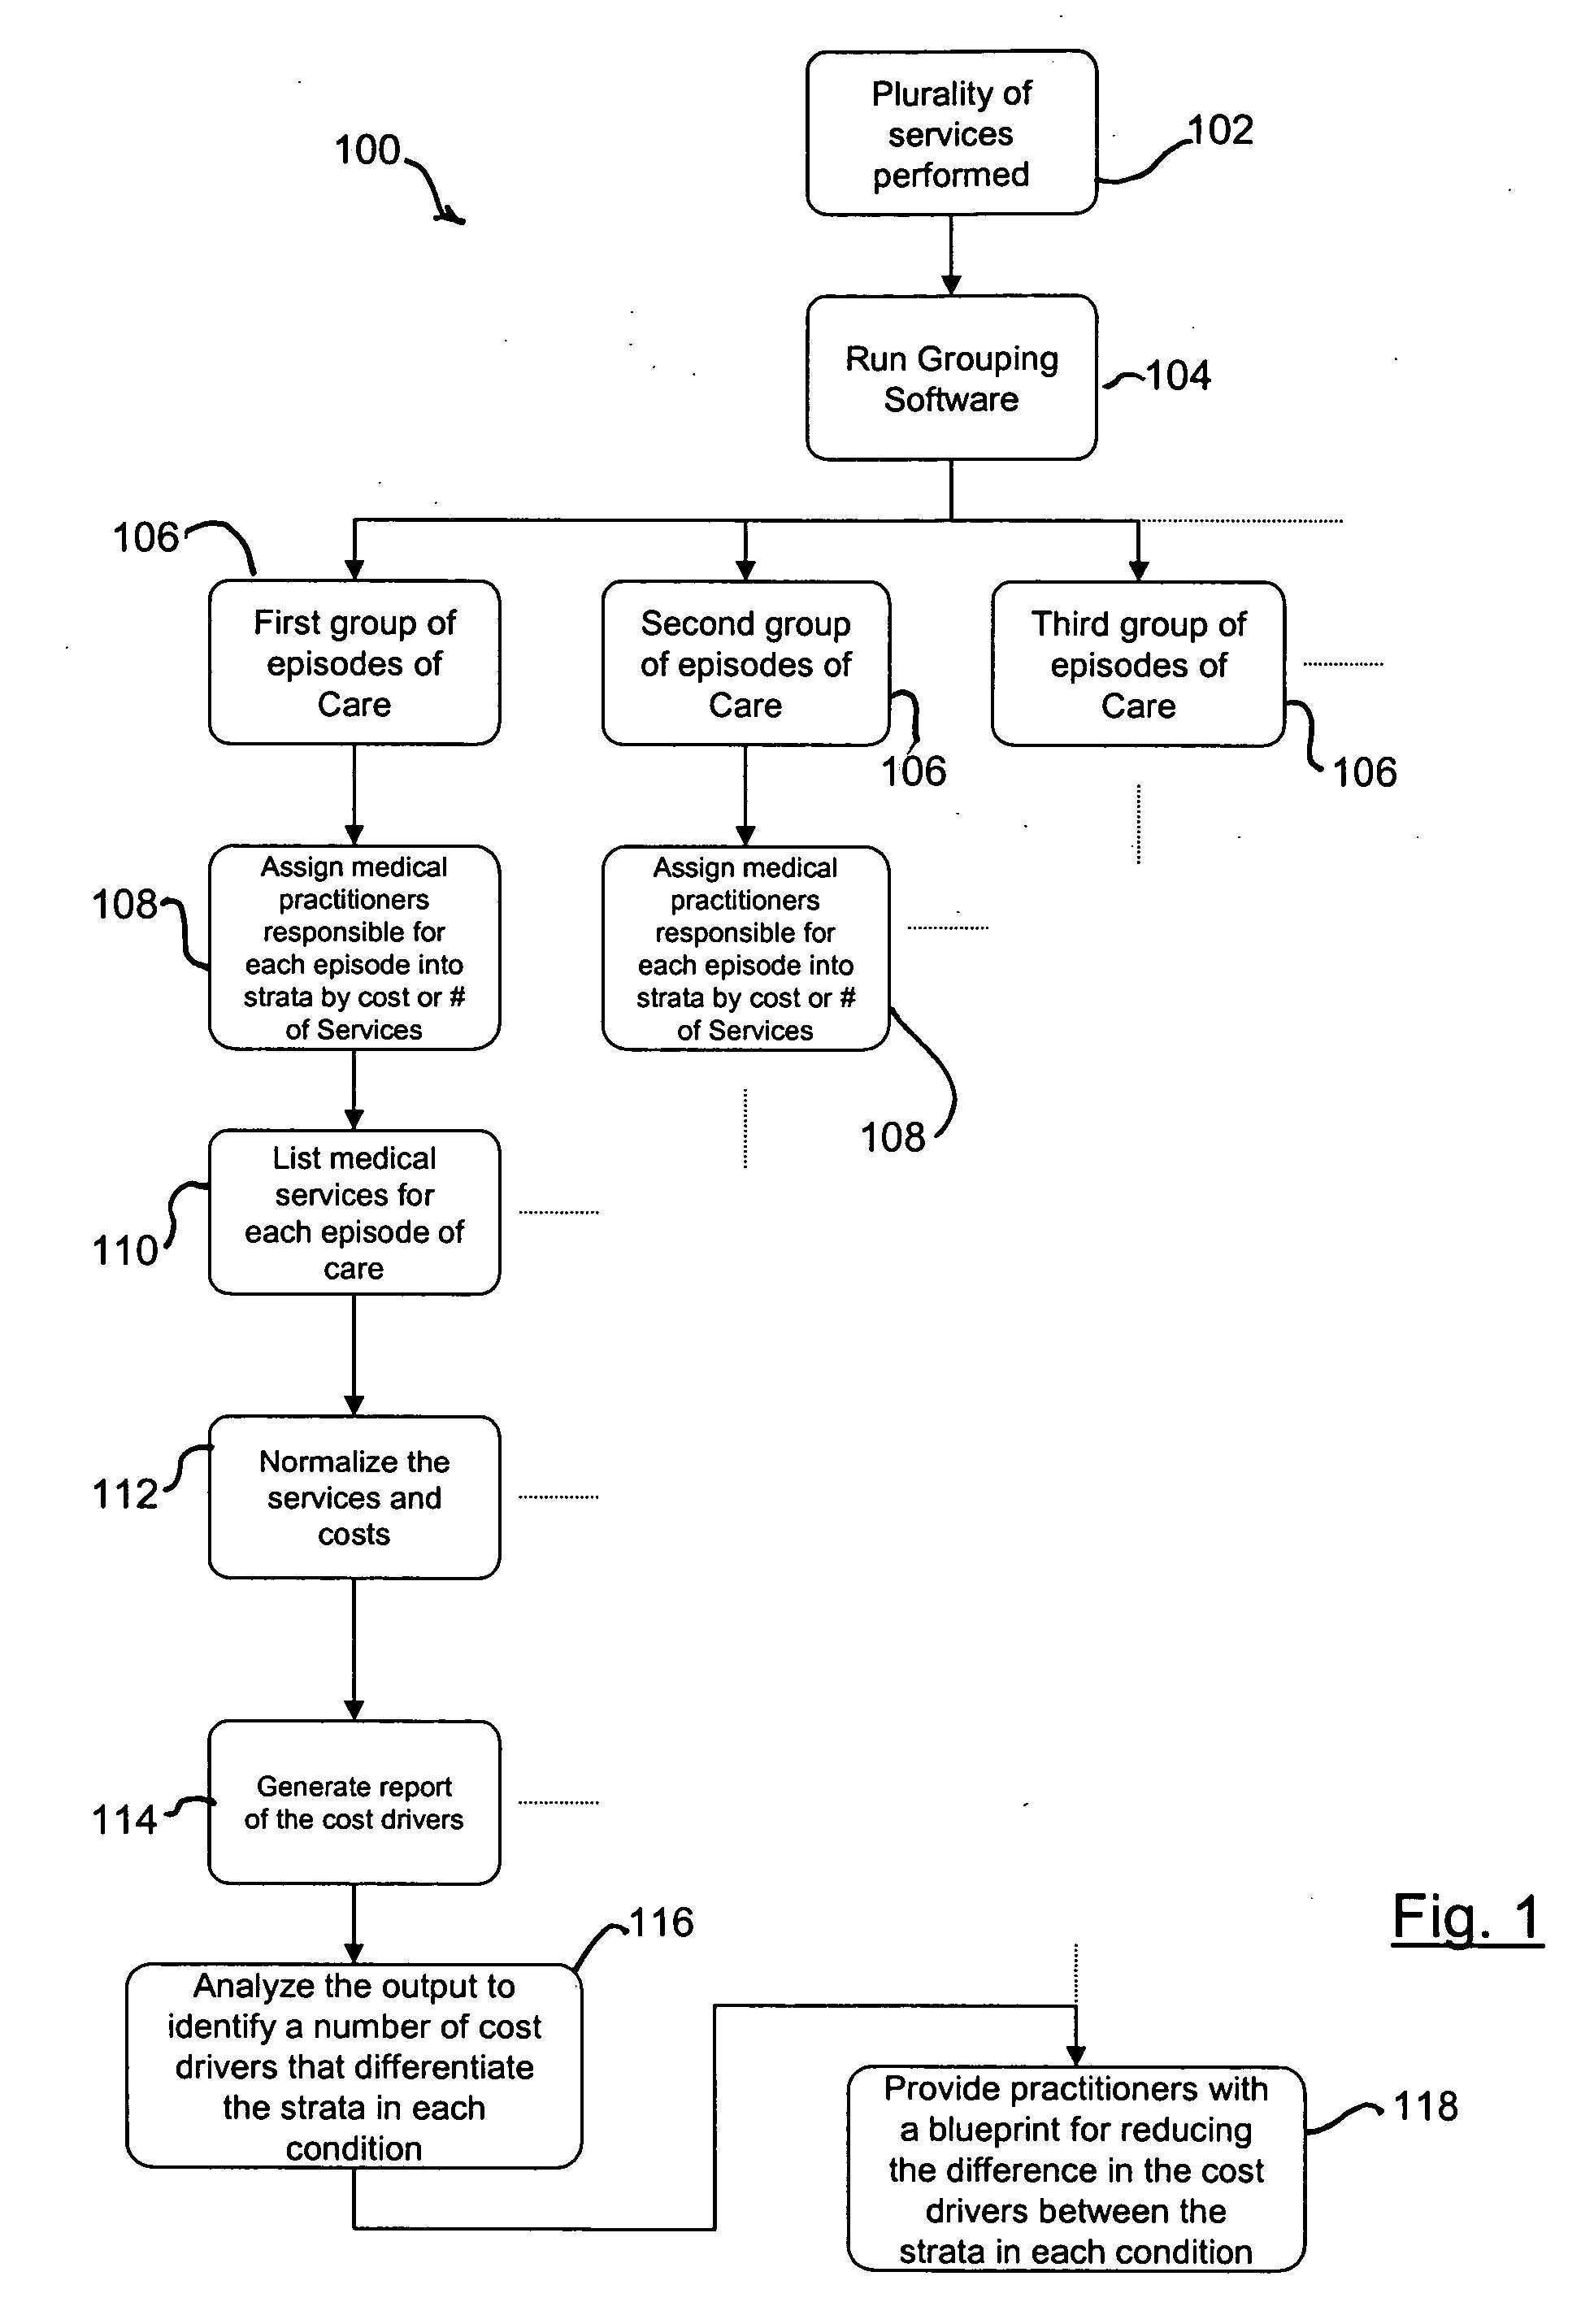
"The invention is a method for analyzing the medical practice patterns of physicians or other medical professionals. It uses data from episodes of care to identify the significant factors that contribute to the cost of medical care. The method allows clinicians to quickly identify the cost drivers and make informed decisions about which services to offer or avoid. It is easy to use and produces results quickly, making it a useful tool for managing medical care. The method can be used to compare different medical professionals and help them improve their practice patterns. Overall, the invention helps to connect cost containment to quality improvement in medical care."

Problems solved by technology

The conventional systems thus might show that there are differences between medical providers, such as one might be more expensive than another; however, they do not take the necessary steps to address what a managed care organization should work on in order to decrease costs of medical care and improve quality.
The conventional systems do not identify what the specific cost drivers are that cause differences between the medical providers.
Further, the conventional systems do not present data in a way that is clinically relevant and easy to present in graphic form to facilitate the discussion of medical appropriateness and allow clinical judgment as to whether the service is under utilized, over utilized, or mis-used, based on medical evidence for or against the service in question.
In other words, the conventional systems do not connect cost containment to quality improvement.
The user must ask specific questions, hypothesizing which services might be cost drivers, for example: “Find out if lab testing is a factor in hypertension care, and then find which tests and who is using them.” Such analyses typically take a number of hundred person-hours of work, develop over a time frame of weeks to months, and may lead down dead ends.
A comprehensive analysis investigating the cost drivers for a plurality of conditions in a number of different specialties would be quite cumbersome using the conventional methods and the results would likely be out of date when the analysis is completed.
Potter, et al. does not teach a timely and comprehensive analysis investigating the underlying cost drivers for a plurality of conditions in a number of different specialties.
The system does not determine what the specific cost drivers are that cause differences between medical providers, nor does it address what an managed care organization should do to decrease costs of medical care and improve quality.
The method does not identify cost drivers for a plurality of conditions in a number of different specialties.
Further, the publication does not teach a process for recommending particular services for treating a patient with a particular diagnosis.
The publication does not teach the identification of specific cost drivers that cause differences between medical providers.
The publication also does not provide a medical practice blueprint that includes a timely analysis of several conditions in several specialties that can be used to provide recommendations regarding certain practice patterns.

Method used


Image

  • Medical practice pattern tool
  • Medical practice pattern tool
  • Medical practice pattern tool

Examples


example a

[0083] In an example, a number of episodes of care for the condition benign neoplasm of the skin, ETG 0682, are analyzed using the medical practice pattern tool. In this example, the medical practitioners are physicians in the specialty of dermatology associated with a medium sized regional managed care organization. The claims data input to the ETG grouper was from a period of two years.

[0084] The user chose to analyze complete episodes of care that were not cost outliers. In the data cleansing step the user had substituted uniform fees for outpatient hospital services. In choosing the top-level of groupings the user kept the Symmetry Grouper categories (ancillary, facility, management, pharmacy, and surgery) but split radiology costs out of ancillary to form a separate category. A sample of the resulting service group file 205 is shown in Table A1. Note that the data at this point contains all episodes from all ETGs for the specialty of dermatology.

[0085] In the example, the use...

example b

[0107] In further example, a number of episodes of care for the condition Allergic Rhinitis, ETG 0332, are analyzed using the medical practice pattern tool. In this example, the medical practitioners are physicians in the specialty of allergy associated with a medium sized regional managed care organization. The claims data input to the ETG grouper was from a period of two years. The system develops the practitioner episode percentage table using the output of the ETG grouper, which provides the list of physicians associated with episodes of care in ETG 0332. For each episode, the system calculates the percentage of involvement of each physician by dividing the sum of the costs of the services the physician is responsible for in that episode by the total cost of the episode. The system then calculates and stores the number of episodes for which each physician contributed to at least 25% of the cost; though, it should be noted that other attribution rules may be used. Now the system ...


PUM


Abstract

The invention is a business process embodied in a software algorithm that determines difference in practice patterns among physicians for the main cost components of given conditions.

Description

CROSS-REFERENCE TO RELATED APPLICATIONS [0001] This application claims priority from U.S. Provisional Patent Application Ser. No. 60 / 731,917, filed Oct. 31, 2005.FIELD OF THE INVENTION [0002] This invention relates to computer-implemented processes for the analysis of medical practice. BACKGROUND OF THE INVENTION [0003] Conventional systems, such as the Episode Treatment Group (ETG) software by Symmetry Health Data System, Inc, various risk adjusters, and other measures of physician service use allow managed care organizations to find rates of utilization of given services, determine relative costs of physician care, and bucket costs into categories such as office visits, pharmacy, and facility use. The conventional systems thus might show that there are differences between medical providers, such as one might be more expensive than another; however, they do not take the necessary steps to address what a managed care organization should work on in order to decrease costs of medical ...

Claims


Application Information

Patent Timeline
Patent Type & Authority Applications(United States)
IPC IPC(8): G06Q10/00G06F7/00
CPCG06Q10/10G06Q50/22G16H40/20Y02A90/10
Inventor GREENE, ROBERT A.
Owner FOCUSED MEDICAL ANALYTICS
Learn More