
Business performance presentation user interface and method for presenting business performance

a business performance and user interface technology, applied in multi-dimensional databases, instruments, data processing applications, etc., can solve problems such as insufficient tools for users, limited to pre-set views of specific items, and traditional performance monitoring tools that do not adapt well to changes in business priorities, initiatives and processes

Inactive Publication Date: 2005-03-31
IBM CORP
View PDF0 Cites 170 Cited by
  • Summary
  • Abstract
  • Description
  • Claims
  • Application Information

AI Technical Summary

Benefits of technology

It is an object of the invention to provide a novel user interface for monitoring business performance that obviates or mitigates at least one of the disadvantages of existing systems.

Problems solved by technology

Analysis of displayed values may be possible, but it is limited to the pre-set views of specific items.
However, those tools are often not sufficient for users who need to see a common, aligned view of business performance of the entire organization.
Furthermore, traditional performance monitoring tools do not adapt well to changes in business priorities, initiatives and processes.
Editing is cumbersome and requires special skills.
Some existing comprehensive systems provide functions for analysing problems, but those systems are too difficult to use without special training and their user interfaces are not sufficiently user friendly.
However, existing scorecard systems are suitable for a department scale analysis and do not give overall views or more in-depth view of the performance of their business.

Method used


Image

  • Business performance presentation user interface and method for presenting business performance
  • Business performance presentation user interface and method for presenting business performance
  • Business performance presentation user interface and method for presenting business performance

Examples


Embodiment Construction

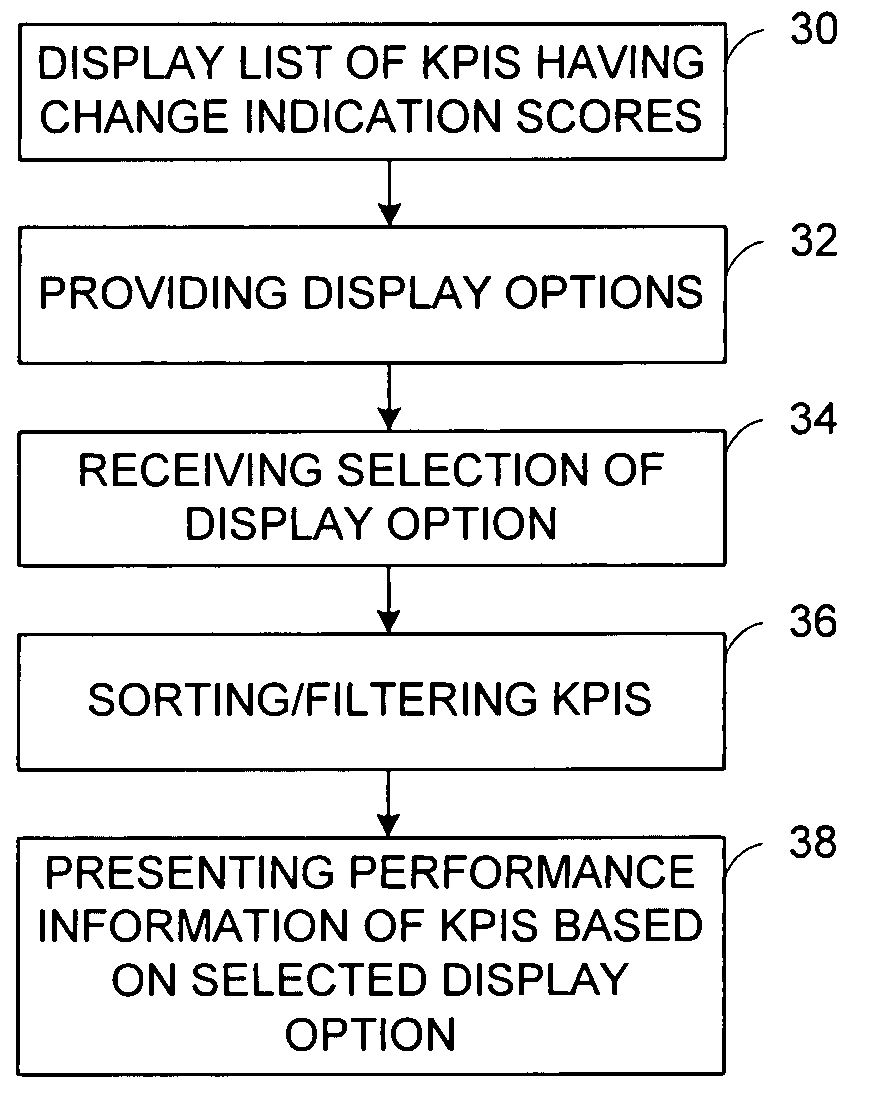
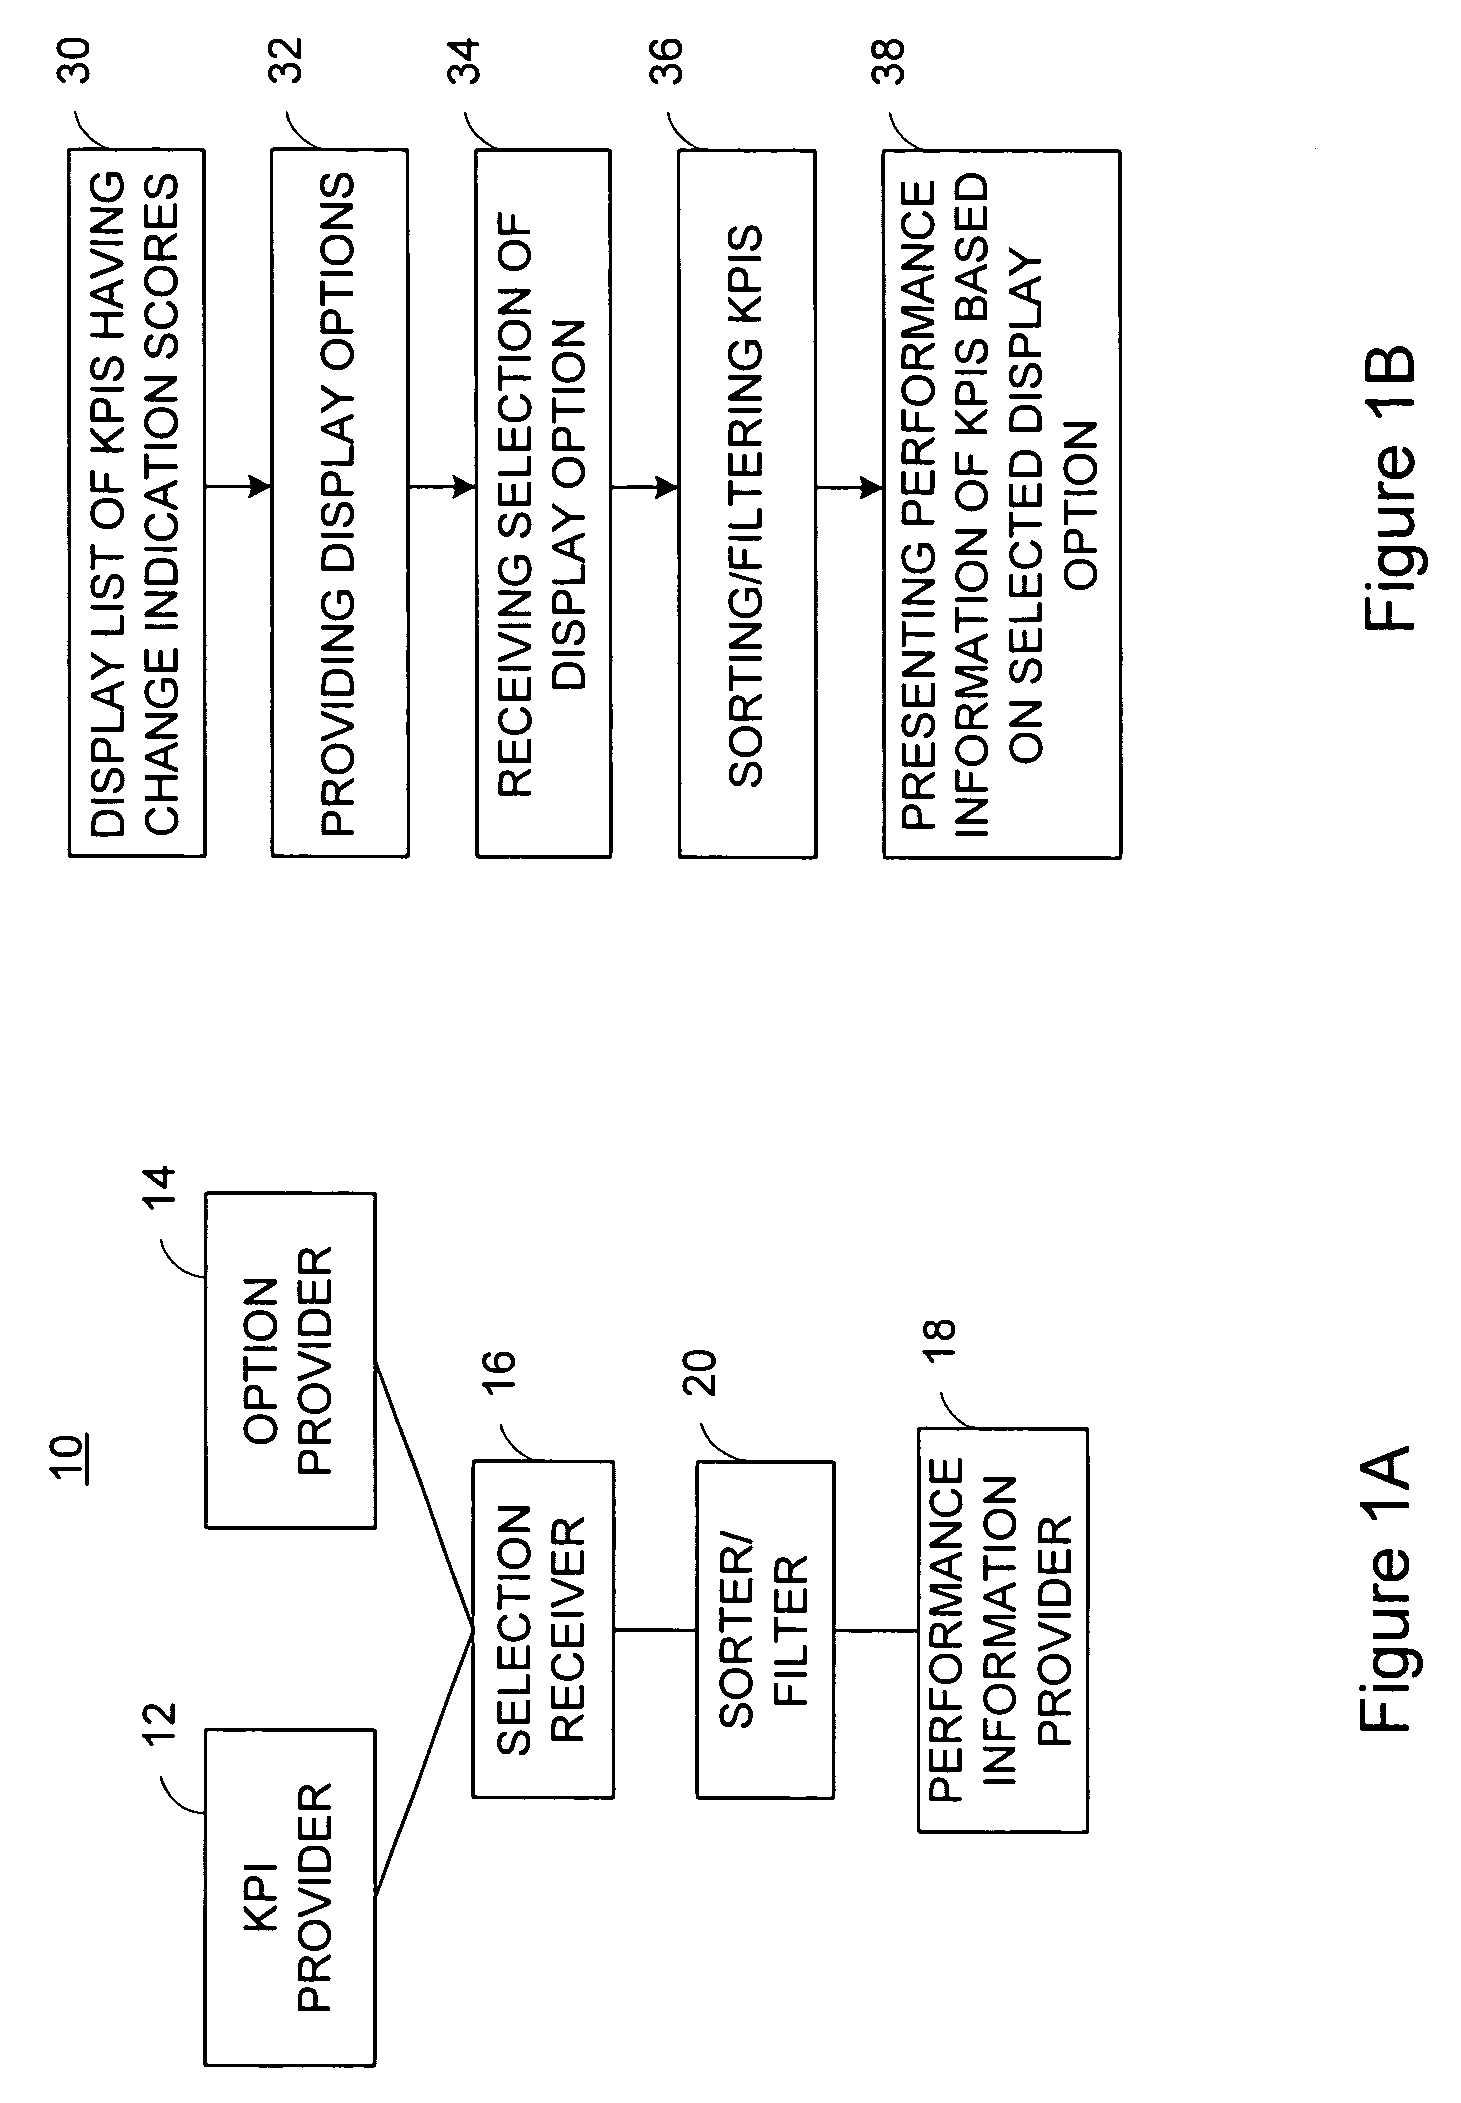
Referring to FIGS. 1A and 1B, a system and method for presenting performance information according to an embodiment of the present invention is described. The performance information user interface system 10 is suitably used to present performances information of an organization without limiting to a specific department in the organization. The business of the organization may or may not be of profitable.

The user interface system 10 comprises a KPI provider 12, option provider 14, selection receiver 16, performance information provider 18 and sorter / filter 20.

The KPI provider 12 displays a list of Key Performance Indicators (KPIs) (30). A KPI is an indicator which is useful to measure performance of an aspect of the business. KPIs may relate to various levels of summarization of data. For example, a Revenue KPI indicates a total revenue of the organization, and a North America Revenue KPI indicates a revenue of the North America for the organization.

According to the embodimen...


PUM


Abstract

Business performance information is presented to users by displaying a list of Key Performance Indicators (KPIs) having delta indication scores indicating changes in the KPIs, providing display options, receiving selection of a display option, and presenting performance information of the KPIs based on the selected display option.

Description

This invention relates to a user interface, and especially to a user interface and method for presenting business performance. BACKGROUND OF THE INVENTION In order to manage a business, it is important to understand how the business is performing. Many organizations store various performance data, such as sales amounts, revenues and account receivables. Organizations use those data to evaluate their business performance. There exist monitoring tools available for assisting users to monitor some performance data. Those, traditional monitoring tools are rigid in their presentation of data. Presentation is driven by an author's view on the business, rather than the performance metrics and their status. Those tools display only pre-set views of specific items as determined by an author of the tool at the time of implementation. Analysis of displayed values may be possible, but it is limited to the pre-set views of specific items. Also, in many organizations, each department has its o...

Claims


Application Information

Patent Timeline
IPC IPC(8): G06Q10/06
CPCG06Q10/00G06F16/283
Inventor ADENDORFF, MICHAELFAZAL, THOMASDEL PASQUA, KIERAN
Owner IBM CORP
Learn More