GIS-based power distribution network load distribution display method and device

A load distribution and distribution network technology, applied in the field of GIS information display, can solve the problems of limited WEB page performance, unsatisfactory display performance and display effect, and not intuitive display effect, etc., to achieve good display performance effect

Pending Publication Date: 2022-06-03
NR ELECTRIC CO LTD +1
View PDF0 Cites 0 Cited by
  • Summary
  • Abstract
  • Description
  • Claims
  • Application Information

AI Technical Summary

Problems solved by technology

[0002] At present, in the practice of displaying the load of distribution network transformers, most of them display the load of a single distribution network transformer, and seldom display the load of distribution network transformers as a whole based on GIS maps. When displaying the load of transformers, due to the huge number of transformers in the distribution network, the performance of the WEB page is limited. If the load of each transformer is rendered, the display performance and display effect are often not ideal, or the two-dimensional effect is used. When thermally displaying the transformer load, the display effect is not intuitive enough, and it is necessary to find a suitable display method for the overall load distribution of the distribution network

Method used


Image

  • GIS-based power distribution network load distribution display method and device

Examples


Embodiment 1

[0030] The embodiment of the present invention provides a GIS-based distribution network load distribution display method, including:

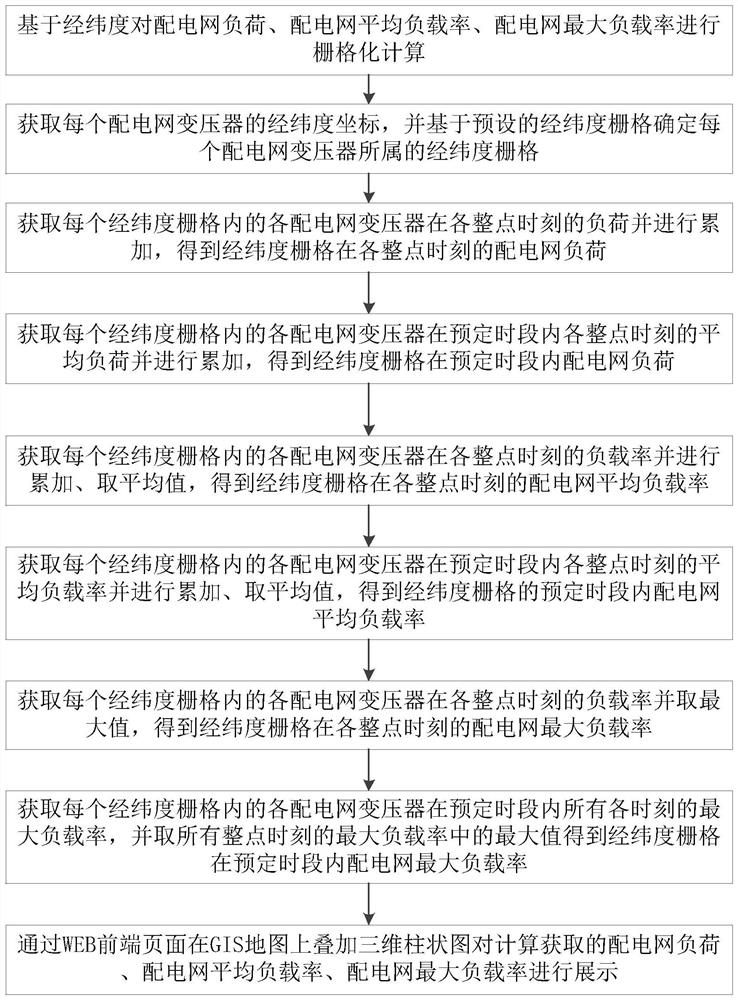
[0031] 1. Based on the longitude and latitude, the grid calculation is performed on the distribution network load, the average load rate of the distribution network, and the maximum load rate of the distribution network.

[0032] Rasterization calculations include:

[0033] S1. Obtain the longitude and latitude coordinates of each distribution network transformer, and determine the longitude and latitude grid to which each distribution network transformer belongs based on the preset longitude and latitude grid; generally retain the 2-digit decimal precision of the longitude and latitude of the distribution network transformer for the convenience of calculation As the longitude and latitude of the longitude and latitude grid to which it belongs, the size of the longitude and latitude grid is about 1.23 square kilometers.

[0034] S2. Acquire t...

Embodiment 2

[0046] The embodiment of the present invention provides a GIS-based distribution network load distribution display device, the device includes:

[0047] The data acquisition module is used for grid calculation of distribution network load, distribution network average load rate, and distribution network maximum load rate based on longitude and latitude;

[0048] The data display module is used to superimpose a three-dimensional histogram on the GIS map through the WEB front-end page to display the calculated distribution network load, the average load rate of the distribution network, and the maximum load rate of the distribution network.

[0049]As will be appreciated by those skilled in the art, the embodiments of the present application may be provided as a method, a system, or a computer program product. Accordingly, the present application may take the form of an entirely hardware embodiment, an entirely software embodiment, or an embodiment combining software and hardwar...


PUM


Abstract

The invention discloses a GIS-based power distribution network load distribution display method and apparatus. The method comprises the steps of performing rasterizing calculation on a power distribution network load, a power distribution network average load rate and a power distribution network maximum load rate based on longitude and latitude; superposing a three-dimensional histogram on a GIS map through a WEB front-end page to display the power distribution network load, the power distribution network average load rate and the power distribution network maximum load rate which are obtained through calculation; according to the method, the problems that when the power distribution network load is displayed on the basis of a map, the number of power distribution network transformers is too large when the power distribution network transformer load is directly displayed, and load display in a two-dimensional mode is not visual enough are solved; the distribution and fluctuation change conditions of the load and the load rate of the power distribution network can be visually seen, meanwhile, the data volume displayed at the front end is controlled, and good display performance is achieved.

Description

technical field [0001] The invention relates to a GIS-based distribution network load distribution display method and device, belonging to the technical field of GIS information display. Background technique [0002] At present, in the practice of load display of distribution network transformers, most of them are the display of the load of a single distribution network transformer, and the overall display of the distribution network transformer load is less based on GIS maps. When the load of the transformer is displayed, due to the huge number of transformers in the distribution network, the performance of the WEB page is limited. If the load of each transformer is rendered, the display performance and display effect are often not ideal, or the two-dimensional effect is used to perform When the thermal display of the transformer load is performed, the display effect is not intuitive enough. It is necessary to find a suitable display method for the overall load distribution...

Claims


Application Information

Patent Timeline
Patent Type & Authority Applications(China)
IPC IPC(8): G06F16/901G06F16/904G06F16/29
CPCG06F16/9024G06F16/904G06F16/29Y04S10/50
Inventor 王黎黎牛锐胡剑峰周季峰
Owner NR ELECTRIC CO LTD
Why Eureka
Try Eureka