A high-precision carrier-to-noise ratio estimation method and system
A carrier-to-noise ratio, high-precision technology, applied in radio wave measurement system, noise figure or signal-to-noise ratio measurement, satellite radio beacon positioning system, etc. issues such as further improvement
- Summary
- Abstract
- Description
- Claims
- Application Information
AI Technical Summary
Problems solved by technology
Method used
Image
Examples
Embodiment 1
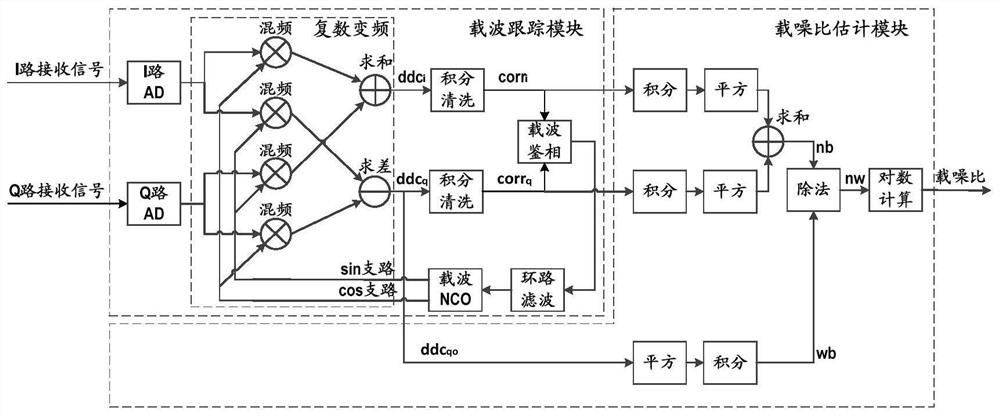
[0156] Such as figure 1 For the complex frequency conversion receiver shown, the implementation steps of carrier-to-noise ratio estimation are as follows:
[0157] (1) The orthogonal I and Q two-way AD sampling signals enter the carrier tracking module, perform complex frequency conversion, and generate two frequency conversion values, which are the frequency conversion value of the in-phase branch and the frequency conversion value of the quadrature branch, and generate the calculation formula of the frequency conversion value as follows:
[0158]
[0159]
[0160] where ddc i 、ddc q Respectively represent the frequency conversion value of the in-phase branch and the frequency conversion value of the quadrature branch, The item represents the I channel AD sampling, The item represents the Q channel AD sampling, where P d Indicates the sampling signal power, ω i Indicates the circular frequency of the sampling signal, T s Indicates the sampling period, n indic...
Embodiment 2
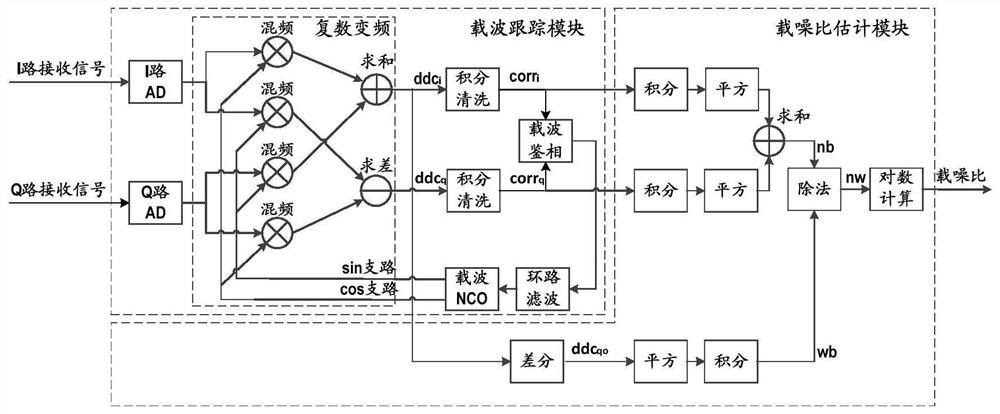
[0182] Such as figure 2 For the complex frequency conversion receiver shown, the implementation steps of carrier-to-noise ratio estimation are as follows:
[0183] (1) The orthogonal I and Q two-way AD sampling signals enter the carrier tracking module, perform complex frequency conversion, and generate two frequency conversion values, which are the frequency conversion value of the in-phase branch and the frequency conversion value of the quadrature branch, and generate the calculation formula of the frequency conversion value as follows:
[0184]
[0185]
[0186] where ddc i 、ddc q Respectively represent the frequency conversion value of the in-phase branch and the frequency conversion value of the quadrature branch, The item represents the I channel AD sampling, The item represents the Q channel AD sampling, where P d Indicates the sampling signal power, ω i Indicates the circular frequency of the sampling signal, T s Indicates the sampling period, n indi...
Embodiment 3
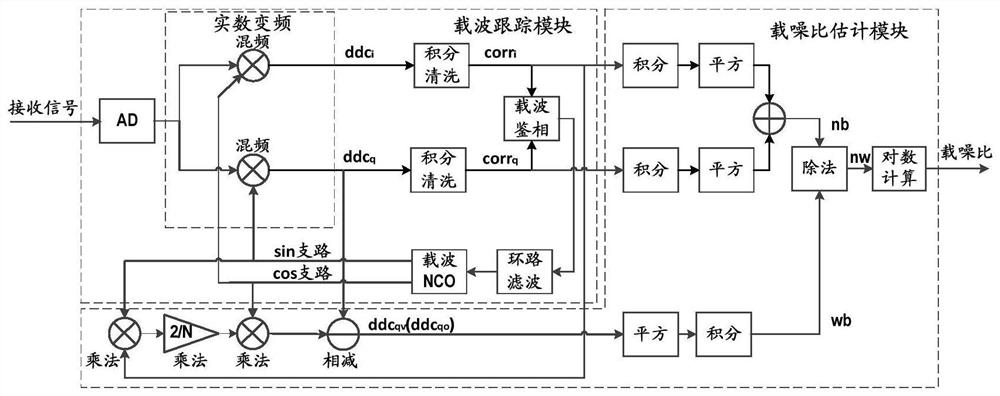
[0208] Such as image 3 For the superheterodyne receiver shown, the implementation steps of carrier-to-noise ratio estimation are as follows:
[0209] (1) One channel of AD sampling signal enters the carrier tracking module, performs real number frequency conversion, and generates two channels of frequency conversion values, which are the frequency conversion value of the in-phase branch and the frequency conversion value of the quadrature branch, and the calculation formula of the frequency conversion value is as follows:
[0210]
[0211]
[0212] In the formula The item represents 1-way AD sampling, where P d Indicates the sampling signal power, ω i Indicates the circular frequency of the sampling signal, T s Indicates the sampling period, n indicates the sampling time, φ i Indicates the sampling signal phase, P n Indicates the sampling noise power, η i (n) represents the unit sampling noise at time n, and η i (n) is random noise with a mean value of zero; whe...
PUM
 Abstract
Description
Claims
Application Information
 - R&D
- Intellectual Property
- Life Sciences
- Materials
- Tech Scout
- Unparalleled Data Quality
- Higher Quality Content
- 60% Fewer Hallucinations
Browse by: Latest US Patents, China's latest patents, Technical Efficacy Thesaurus, Application Domain, Technology Topic, Popular Technical Reports.
© 2025 PatSnap. All rights reserved.Legal|Privacy policy|Modern Slavery Act Transparency Statement|Sitemap|About US| Contact US: help@patsnap.com


