Method and application for determining donor and acceptor differential SNPs
A donor and acceptor technology, applied in the field of bioinformatics, to achieve the effect of intuitive digital results display
- Summary
- Abstract
- Description
- Claims
- Application Information
AI Technical Summary
Problems solved by technology
Method used
Image
Examples
Embodiment 1
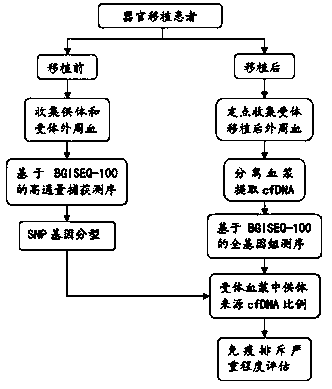
[0060] The method and / or device for determining differential SNPs of the present invention are used in the monitoring of immune rejection of organ transplantation, and the idea of the experimental part is as follows figure 1 As shown, it can be divided into two steps:
[0061] (1) Perform target region capture sequencing on donors and recipients of organ transplantation for genotyping, enabling the distinction of donors and recipients at the genetic level;
[0062] (2) Whole-genome sequencing was performed on the plasma cfDNA of each blood collection point, and the percentage of donor cfDNA in the plasma of each blood collection point to the total cfDNA was analyzed and evaluated.
[0063] 1. Genomic target region capture for SNP typing
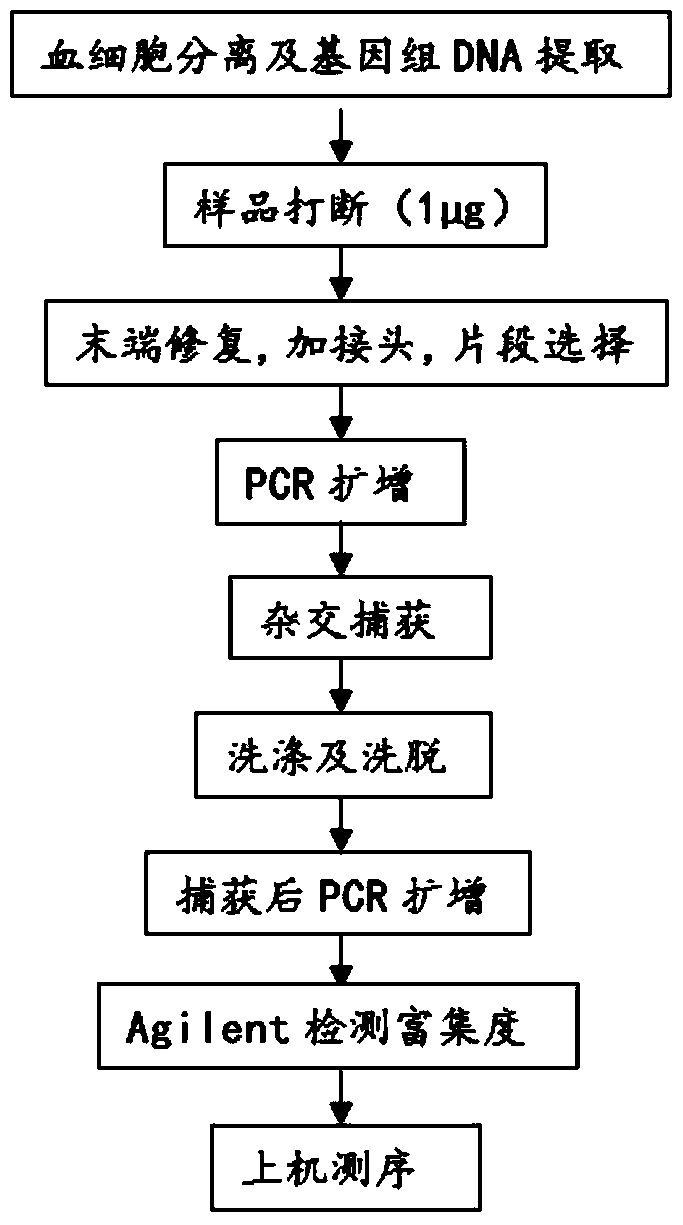
[0064] The experimental procedure of this part is as follows: figure 2 As shown, the genomic DNA is first broken into a small fragment DNA of 150-250bp in the main band, and the ends of the broken DNA fragments are blunted. After adding ...
Embodiment 2
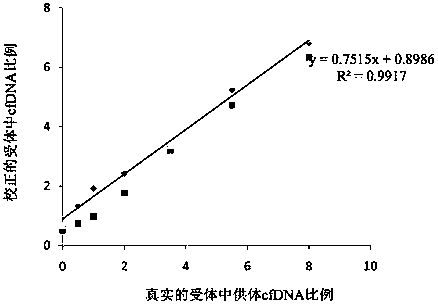
[0083] In order to prove that the experimental method is feasible, the inventor designed this embodiment. The design idea is as follows: take 2 normal human blood samples (taken from volunteers), one as a donor and the other as a recipient for simulation. The collected blood samples are separated from blood cells and plasma. After the genomic DNA is extracted from the blood cells, the DNA is interrupted and the target region is captured and sequenced for genotyping. After the cfDNA is extracted from the plasma, Agelint 2100 measures its exact concentration. , 0.5%, 1.5%, 3.5%, 5.5%, and 8% were mixed, and then the mixed cfDNA library was sequenced to test the reliability of this experimental method. According to the above experimental steps, the steps of this example are divided into two steps, 1. Genome target region capture and sequencing; 2. Each mixed cfDNA library construction and sequencing. details as follows.
[0084] In the examples, adapters and PCR amplification p...
Embodiment 3
[0272] After obtaining the sequencing data, the flow of the data analysis method is as follows: Figure 6 generally include the following steps:
[0273] 1. Alignment with the reference genome. The effective sequencing data of BGISEQ-100 was aligned to the reference genome using the tmap tool to obtain accurate alignment results. where the tmap tool is derived from: https: / / github.com / iontorrent / TS / tree / master / Analysis / TMAP .
[0274] 2. Compare the results to remove PCR duplicates. The BamDuplicates tool was used to remove PCR duplicates from the results (bam format) compared with the tmap tool. Among them, the BamDuplicates tool comes from Ion TorrentSystems.
[0275] 3. Statistics and quality control. Count the ratio of the data volume of the target area to the total data volume, the average sequencing depth of the target area, the coverage rate of the target area, etc., and generate a series of quality control indicators to judge the quality of the sequencing dat...
PUM
 Abstract
Description
Claims
Application Information
 - R&D
- Intellectual Property
- Life Sciences
- Materials
- Tech Scout
- Unparalleled Data Quality
- Higher Quality Content
- 60% Fewer Hallucinations
Browse by: Latest US Patents, China's latest patents, Technical Efficacy Thesaurus, Application Domain, Technology Topic, Popular Technical Reports.
© 2025 PatSnap. All rights reserved.Legal|Privacy policy|Modern Slavery Act Transparency Statement|Sitemap|About US| Contact US: help@patsnap.com


