A multi-objective optimization method based on Gaussian process simultaneous mimo model
A multi-objective optimization and Gaussian process technology, applied in the field of multi-objective optimization design of Gaussian process simultaneous modeling combined with optimization algorithms, can solve the problem of insufficient utilization of system information, small sample size, and cross-correlation model fitting of category input variables or the prediction accuracy cannot be captured and other issues
- Summary
- Abstract
- Description
- Claims
- Application Information
AI Technical Summary
Problems solved by technology
Method used
Image
Examples
Embodiment 1
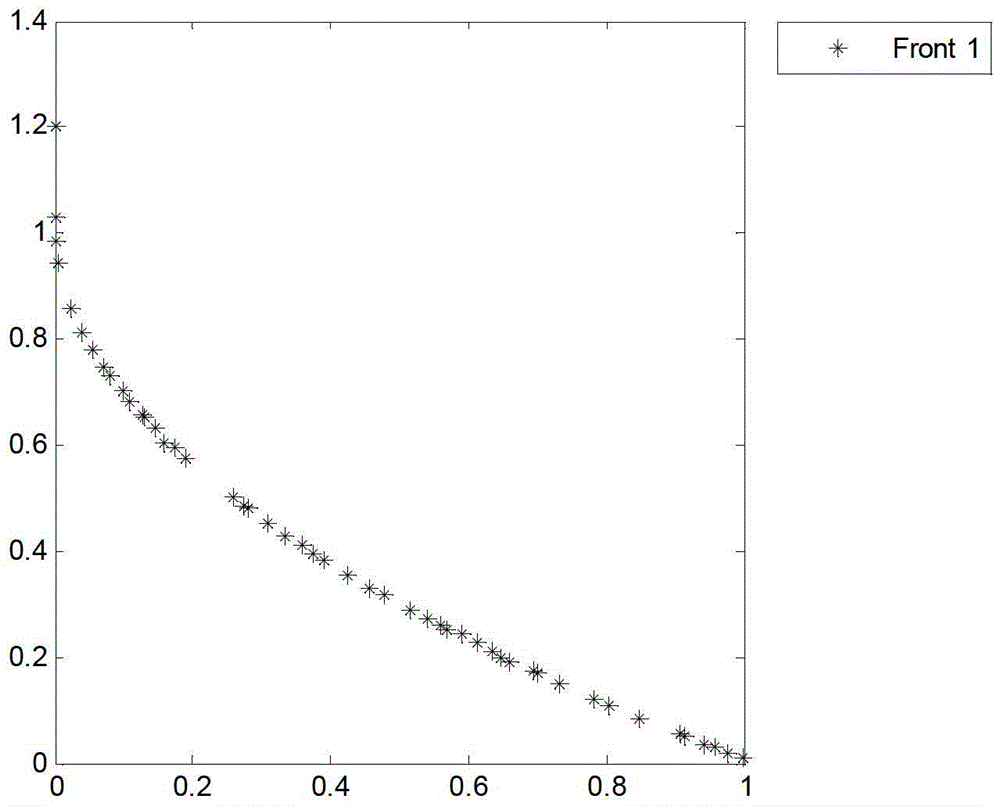
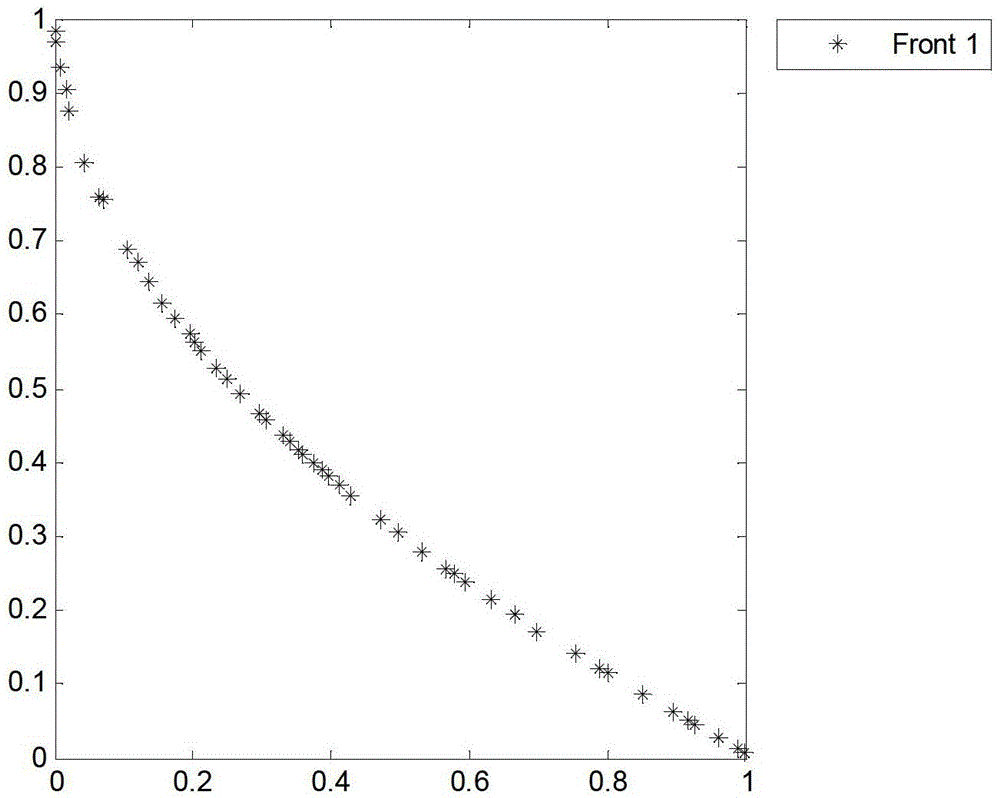
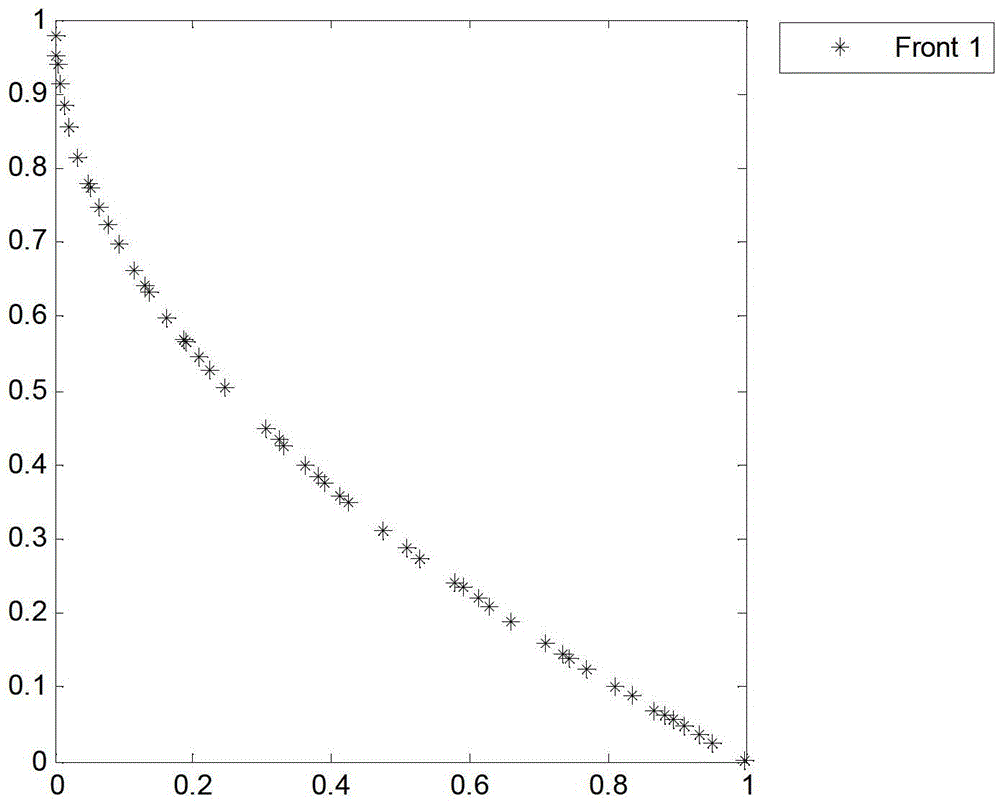
[0053] Numerical examples for solving multi-objective problems
[0054] A multi-objective optimization method based on a Gaussian process simultaneous MIMO model, including experimental design method sampling, standard Gaussian process simultaneous MIMO model and multi-objective optimization algorithm optimization, including the following steps:
[0055] Step 1. According to the numerical multi-objective problem given by the user, its mathematical description is as formula (9), and the experimental design is carried out through the Latin hypercube experimental design method, and 20 sample points are obtained by sampling in the variable x∈[0,1]. And substitute into the analytical formula f of formula (9) 1 , g(x 1 ,x 2 ), get the corresponding response value, and form the training data set of the model together with the sample set of variable x;
[0056] f 1 =x 1
[0057] f 2 =g(x 1 ,x 2 )h(x 1 ,x 2 )
[0058] g(x 1 ,x 2 )=11+x 2 2 -10cos(2πx 2 )(9)
[0059] ...
Embodiment 2
[0088] Application of Multi-objective Optimization Method Based on Gaussian Process Simultaneous MIMO Model in Sheet Metal Drawing
[0089] Using the multi-objective optimization method based on the Gaussian process simultaneous MIMO model to optimize the rear cover of an automobile axle housing, such as Figure 6 and Figure 7 As shown, the multi-objective optimization of deep drawing process parameters, the optimization process flow chart is as follows Figure 8 shown, including the following steps:
[0090] Step 1. Select the forming process parameters to be optimized according to the process documents formulated by the customer, and determine their value ranges as follows: 80≤BHF(kN)≤500, 275≤Bill diameter D(mm)≤325, 0.10≤Static friction coefficient μ between sheet metal and die 1 ≤0.15, 0.10≤Static friction coefficient μ of sheet metal and blank holder ring 2 ≤0.15, through the enhanced translation propagation Latin hypercube (ETPLHD) sampling method for experimental ...
PUM
 Abstract
Description
Claims
Application Information
 - R&D Engineer
- R&D Manager
- IP Professional
- Industry Leading Data Capabilities
- Powerful AI technology
- Patent DNA Extraction
Browse by: Latest US Patents, China's latest patents, Technical Efficacy Thesaurus, Application Domain, Technology Topic, Popular Technical Reports.
© 2024 PatSnap. All rights reserved.Legal|Privacy policy|Modern Slavery Act Transparency Statement|Sitemap|About US| Contact US: help@patsnap.com


