Method and device for predicting telecom traffic
A forecasting method and traffic volume technology, applied in the field of telecommunication networks, to achieve the effect of accurate forecasting accuracy and simple and easy-to-use forecasting scheme
- Summary
- Abstract
- Description
- Claims
- Application Information
AI Technical Summary
Problems solved by technology
Method used
Image
Examples
example 1
[0054] Method example 1: Traffic forecast
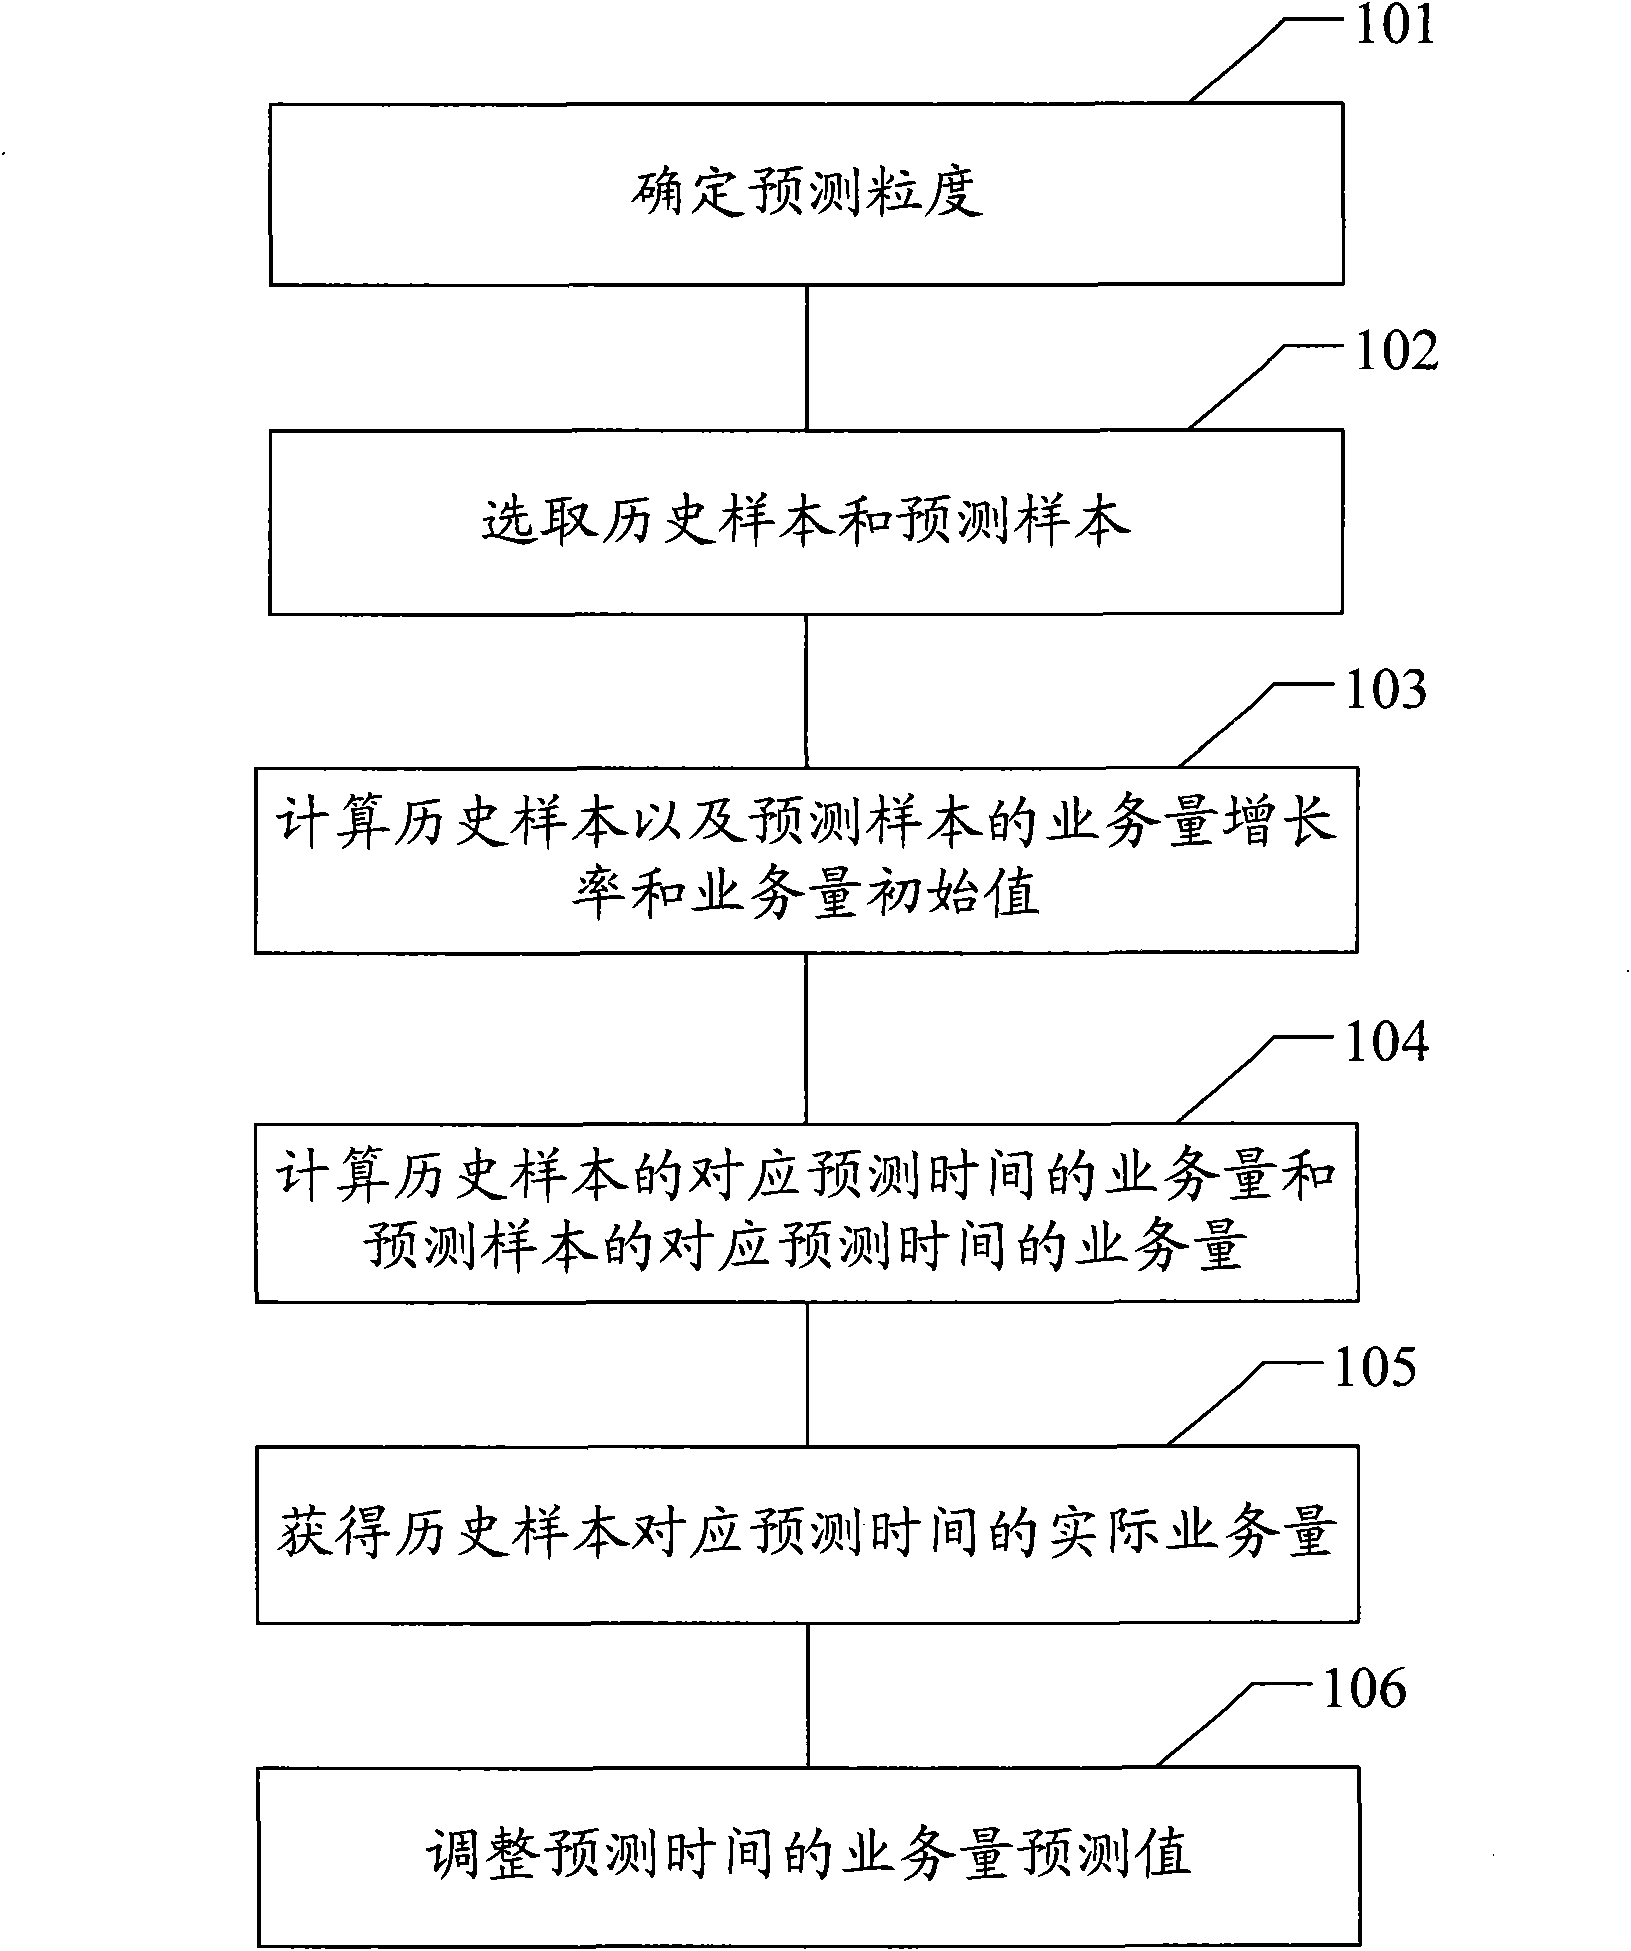
[0055] In the following, taking the voice service of Province A during the "May 1st" Labor Day in 2009 as an example, the method for forecasting the telecommunication service volume of the present invention and its effect will be described in detail. It includes the following steps:
[0056] Step 1: Select the daily traffic volume generated at the mobile switching center in Province A from April 30 to May 3, 2009 as the prediction granularity.
[0057] Step 2: Select the daily traffic volume generated at the mobile switching center in Province A from April 1, 2009 to April 23, 2009 as the forecast sample, as shown in Table 1:
[0058] Date
Traffic
Date
Traffic
Date
Traffic
April 1
465496.6495
April 9
467208.2000
April 17
486043.2632
[0059] April 2
462500.8755
April 10
473943.7504
April 18
427970.0125
April 3
471012.9628
April 11
427970.0125
April 19
413297.4748
April 4
402057.8877
April 12
413297.4748
April 20
...
example 2
[0089] Method example 2: forecasting the volume of short messages
[0090] To further illustrate the effect of the method embodiment of the present invention, the following takes the forecast of the number of short messages from April 30 to May 3, 2009 in Province A as an example. The calculation steps are the same as the previous examples, and only relevant data are listed here for explanation.
[0091] 1. About historical samples and prediction samples
[0092] The data list of the number of short messages from April 1, 2008 to April 23, 2008 and from April 1, 2009 to April 23, 2009, is shown in Table 8. Unit: million:
[0093] Date
Year 2008
Year 2009
Date
Year 2008
Year 2009
April 1
204.43
239.86
April 13
166.94
231.21
April 2
174.54
228.72
April 14
174.65
230.88
April 3
186.04
232.84
April 15
177.21
225.07
April 4
181.18
228.32
April 16
173.12
224.66
April 5
168.99
220.19
April 17
173.75
226.57
April 6
168.03
218.75
April 18
172.69
222.83
April 7 ...
PUM
 Abstract
Description
Claims
Application Information
 - R&D
- Intellectual Property
- Life Sciences
- Materials
- Tech Scout
- Unparalleled Data Quality
- Higher Quality Content
- 60% Fewer Hallucinations
Browse by: Latest US Patents, China's latest patents, Technical Efficacy Thesaurus, Application Domain, Technology Topic, Popular Technical Reports.
© 2025 PatSnap. All rights reserved.Legal|Privacy policy|Modern Slavery Act Transparency Statement|Sitemap|About US| Contact US: help@patsnap.com


