
Method for manufacturing parts based on analysis of weighted statistical indicators

a statistical indicator and manufacturing method technology, applied in the field of statistical indicators, can solve the problems of affecting the quality of parts manufactured, affecting the production process, and affecting the quality of parts, so as to reduce the deviation and reduce the deviation identified

Active Publication Date: 2018-09-20
SN DETUDE & DE CONSTR DE MOTEURS DAVIATION S N E C M A
View PDF2 Cites 9 Cited by
  • Summary
  • Abstract
  • Description
  • Claims
  • Application Information

AI Technical Summary

Benefits of technology

The patent proposes a method for manufacturing parts by measuring the dimensions of parts made by a manufacturing device and analyzing the data to determine if there is a deviation from a standard. The method uses statistical indicators, such as a capability index or centring coefficient, to measure the deviation of the parts from the standard. The method also includes steps to adjust the manufacturing device to reduce the deviation between the parts and the standard. The technical effect of this method is to improve the quality of parts manufactured by optimizing the deviation between the statistical indicator and the standard.

Problems solved by technology

Today it is difficult to imagine performing quality control on all parts manufactured except to considerably impair manufacturing throughput.
In some cases, these statistical controls during production can result in production stopping completely, especially if the parts produced present excessive quality defects and the manufacturing flow must be completely reinitialised.
The disadvantage of such a process capability index Cp is that a positive result (that is, high) can also correspond to production outside the limits of tolerance.
These methods of production monitoring are not satisfactory however when the manufacturing flow of parts is not substantial enough, that is, when the number of parts of the sample taken is too small and / or very different between two successive samplings.

Method used


Image

  • Method for manufacturing parts based on analysis of weighted statistical indicators
  • Method for manufacturing parts based on analysis of weighted statistical indicators

Examples


Embodiment Construction

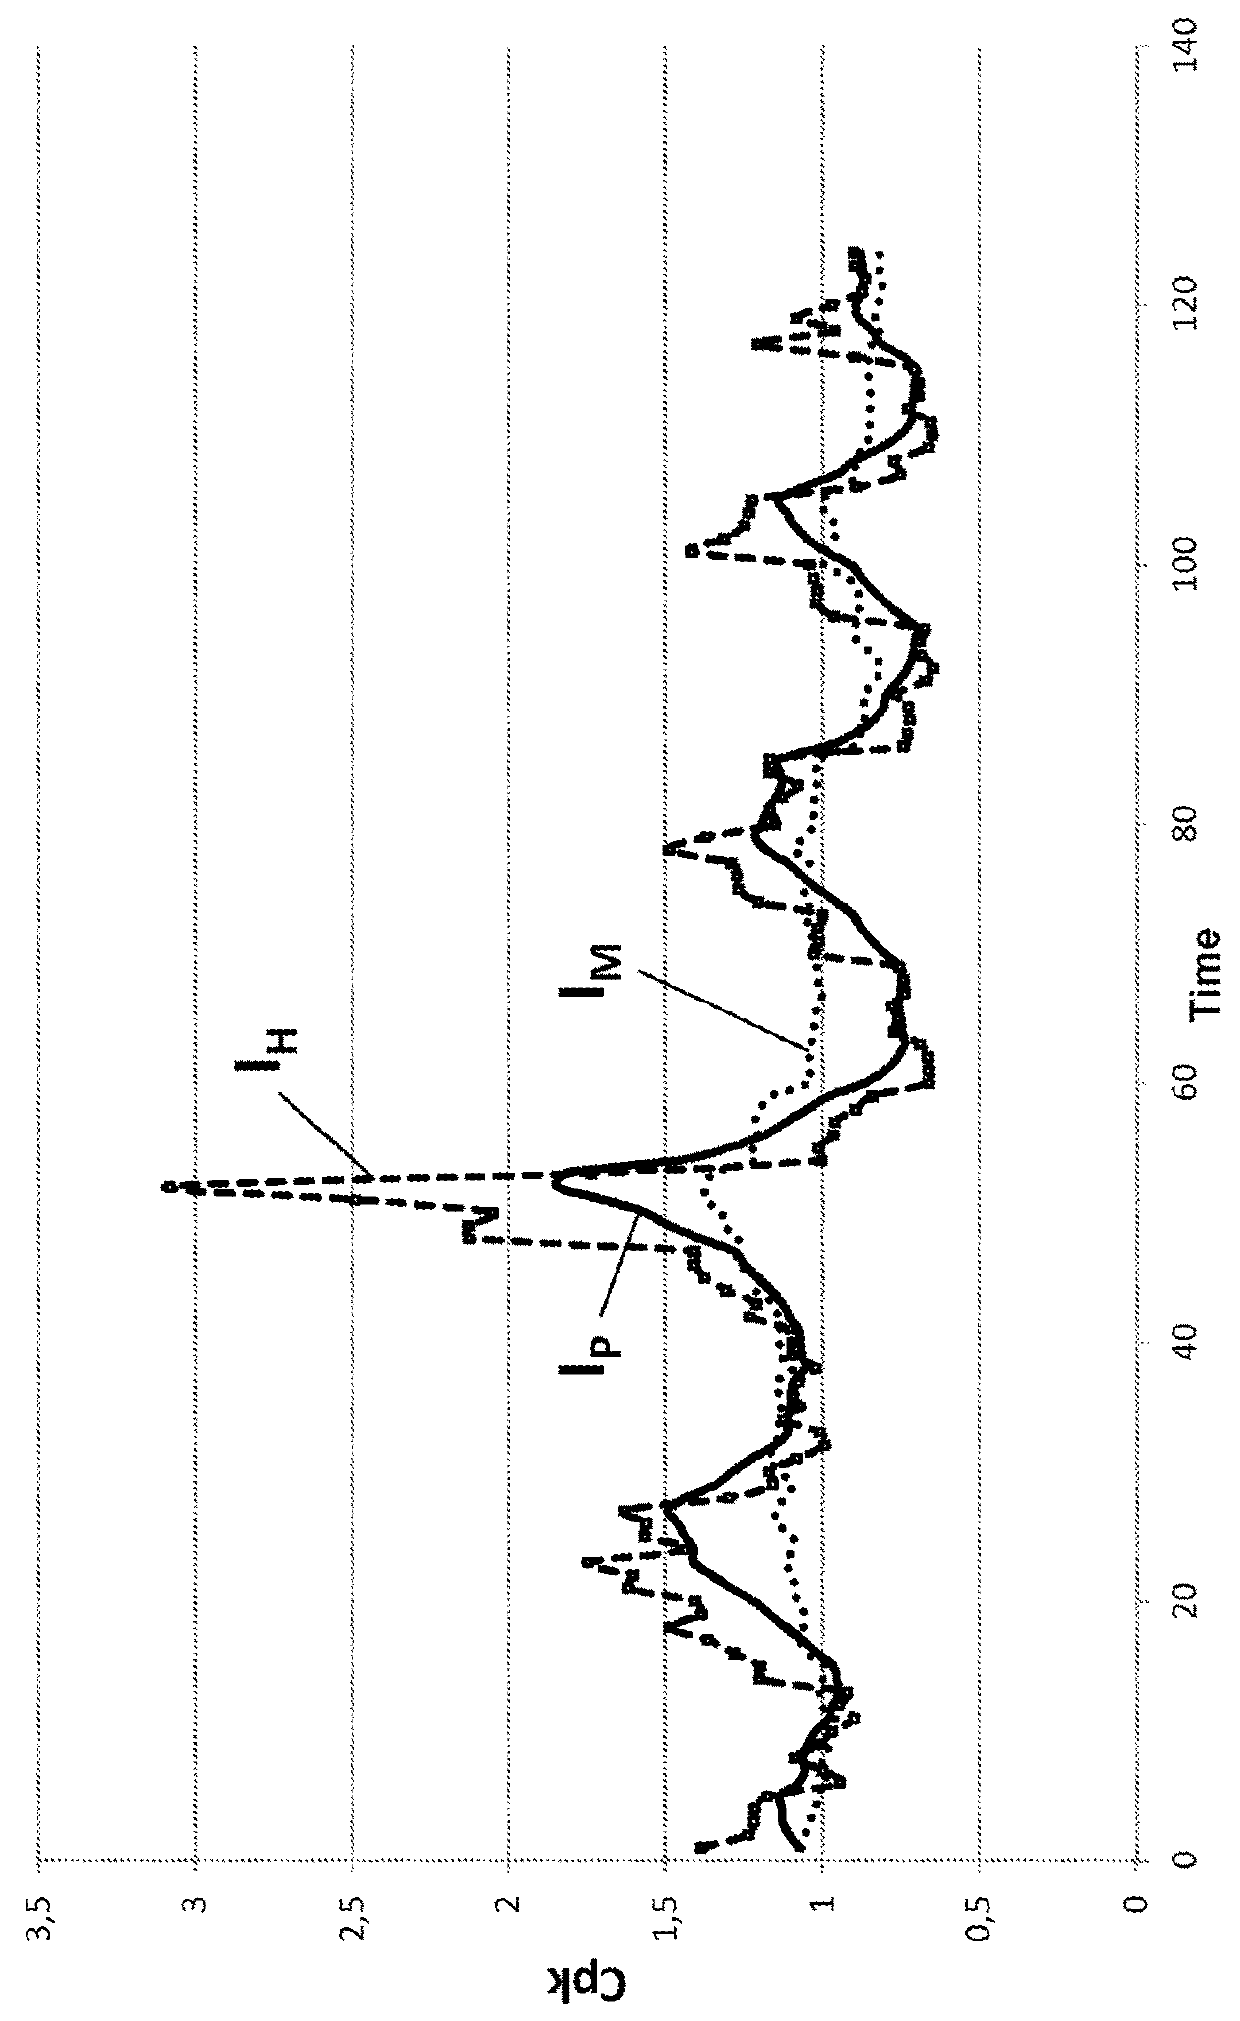
[0082]To respond to the restrictions of variability in production, which impacts not only on the average of the measured characteristic dimension during sampling, but also on the standard deviation of these measurements, it is proposed to calculate for each sample taken a weighted average and a weighted standard deviation of the characteristic dimension according to exponential weighting.

[0083]This calculation is preferably based on the average and the standard deviation of characteristic dimensions measured on the parts of the sample taken, as well as on the weighted averages and the weighted standard deviations of the characteristic dimension which have been calculated for samples taken previously.

[0084]For weighting of the average for example, the monitored index is a weighted average of the decentring of production to be noted as Mt, and which is calculated at the period t+1 as follows, as a function of decentring data of the period t+1 noted μt+1, and of the index calculated at...


PUM


Abstract

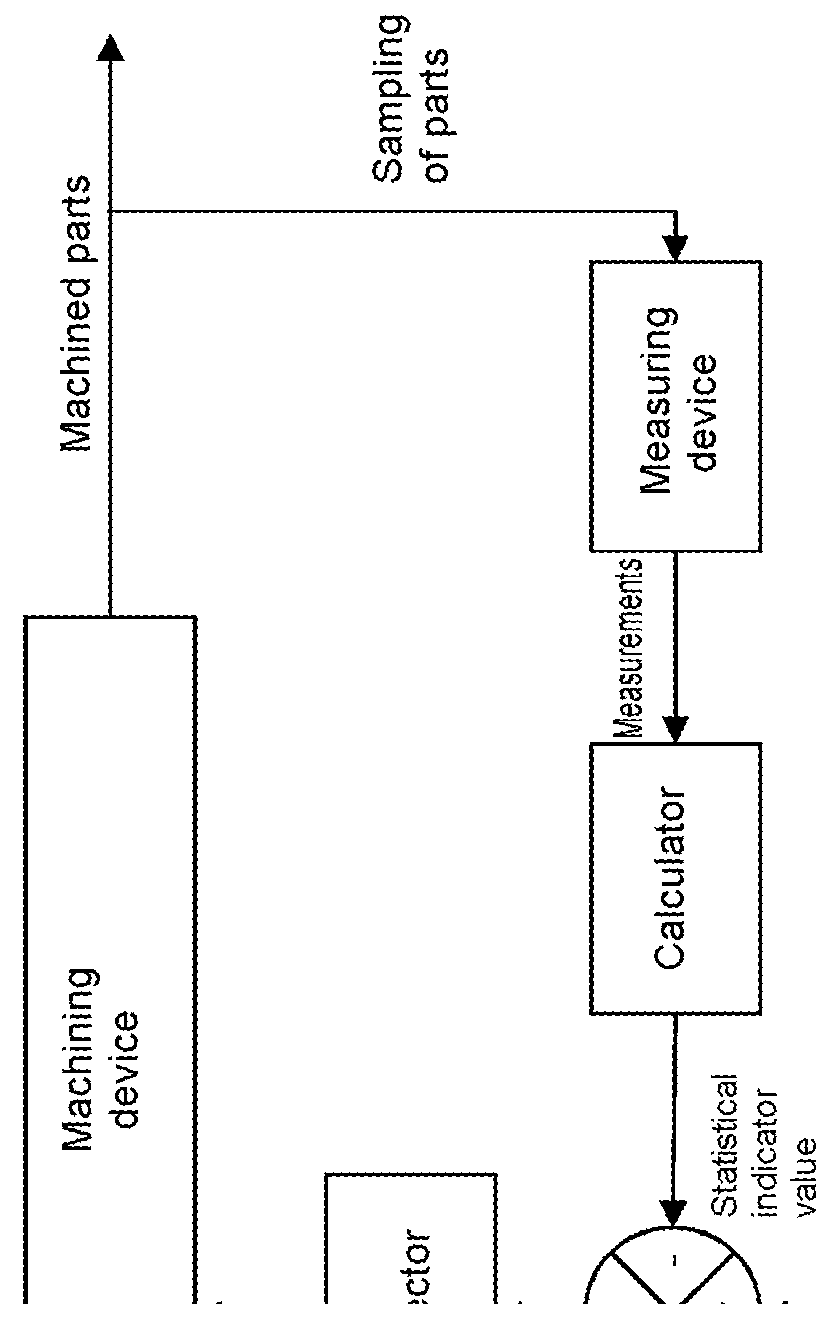
The invention pertains to a method of manufacturing parts produced with a manufacturing device, based on the analysis of at least one statistical indicator representative of a characteristic dimension of the parts, according to which: a) in the course of time several samples are collected, each sample comprising several parts produced with the manufacturing device; b) the characteristic dimension of each part of the sample is measured; c) for each sample collected a weighted mean and a weighted standard deviation of the characteristic dimension are calculated according to an exponential weighting on the basis of a mean and standard deviation of the characteristic dimensions measured on the parts of said sample, of weighted means and of weighted standard deviations of the characteristic dimension which are calculated for previously collected samples; d) for each sample collected a value of the statistical indicator is calculated on the basis of the weighted mean and of the weighted standard deviation thus calculated; e) a value of the statistical indicator thus calculated for the sample collected is compared with a reference value to detect a possible deviation; f) the manufacture of the parts is steered as a function of the results of the comparison by fitting the manufacturing device adjustment parameters to optimize the deviation between the value of the statistical indicator and the reference value.

Description

FIELD OF THE INVENTION[0001]The invention relates to the use of statistical indicators in an industrial setting, for example, in the aeronautics industry, in particular for facilitating monitoring and control of the manufacturing of parts.PRIOR ART[0002]The manufacture of parts, especially mechanical parts, in an industrial setting is met with two opposing constraints: specifically, the increase in manufacturing throughput and volumes on the one hand, and the increased quality requisites on the other, which is particularly true in the aeronautical field.[0003]Today it is difficult to imagine performing quality control on all parts manufactured except to considerably impair manufacturing throughput. Statistical manufacturing indicators are therefore generally used, reliably deducing overall information on the quality of the set of parts manufactured from specific information on the quality of a finite number of parts taken as samples.[0004]Apart from controls at the end of production...

Claims


Application Information

Patent Timeline
Patent Type & Authority Applications(United States)
IPC IPC(8): G05B19/418G06Q10/06G06Q50/04
CPCG05B2219/32201G05B2219/32191G06Q10/06395G05B19/41875G06Q50/04Y02P90/30
Inventor FERRY, OLIVIERCAMBEFORT, ARNAUDCOURTIN, PASCALHARDOUIN, NICOLASCLERET DE LANGAVANT, CHARLES
Owner SN DETUDE & DE CONSTR DE MOTEURS DAVIATION S N E C M A
Learn More