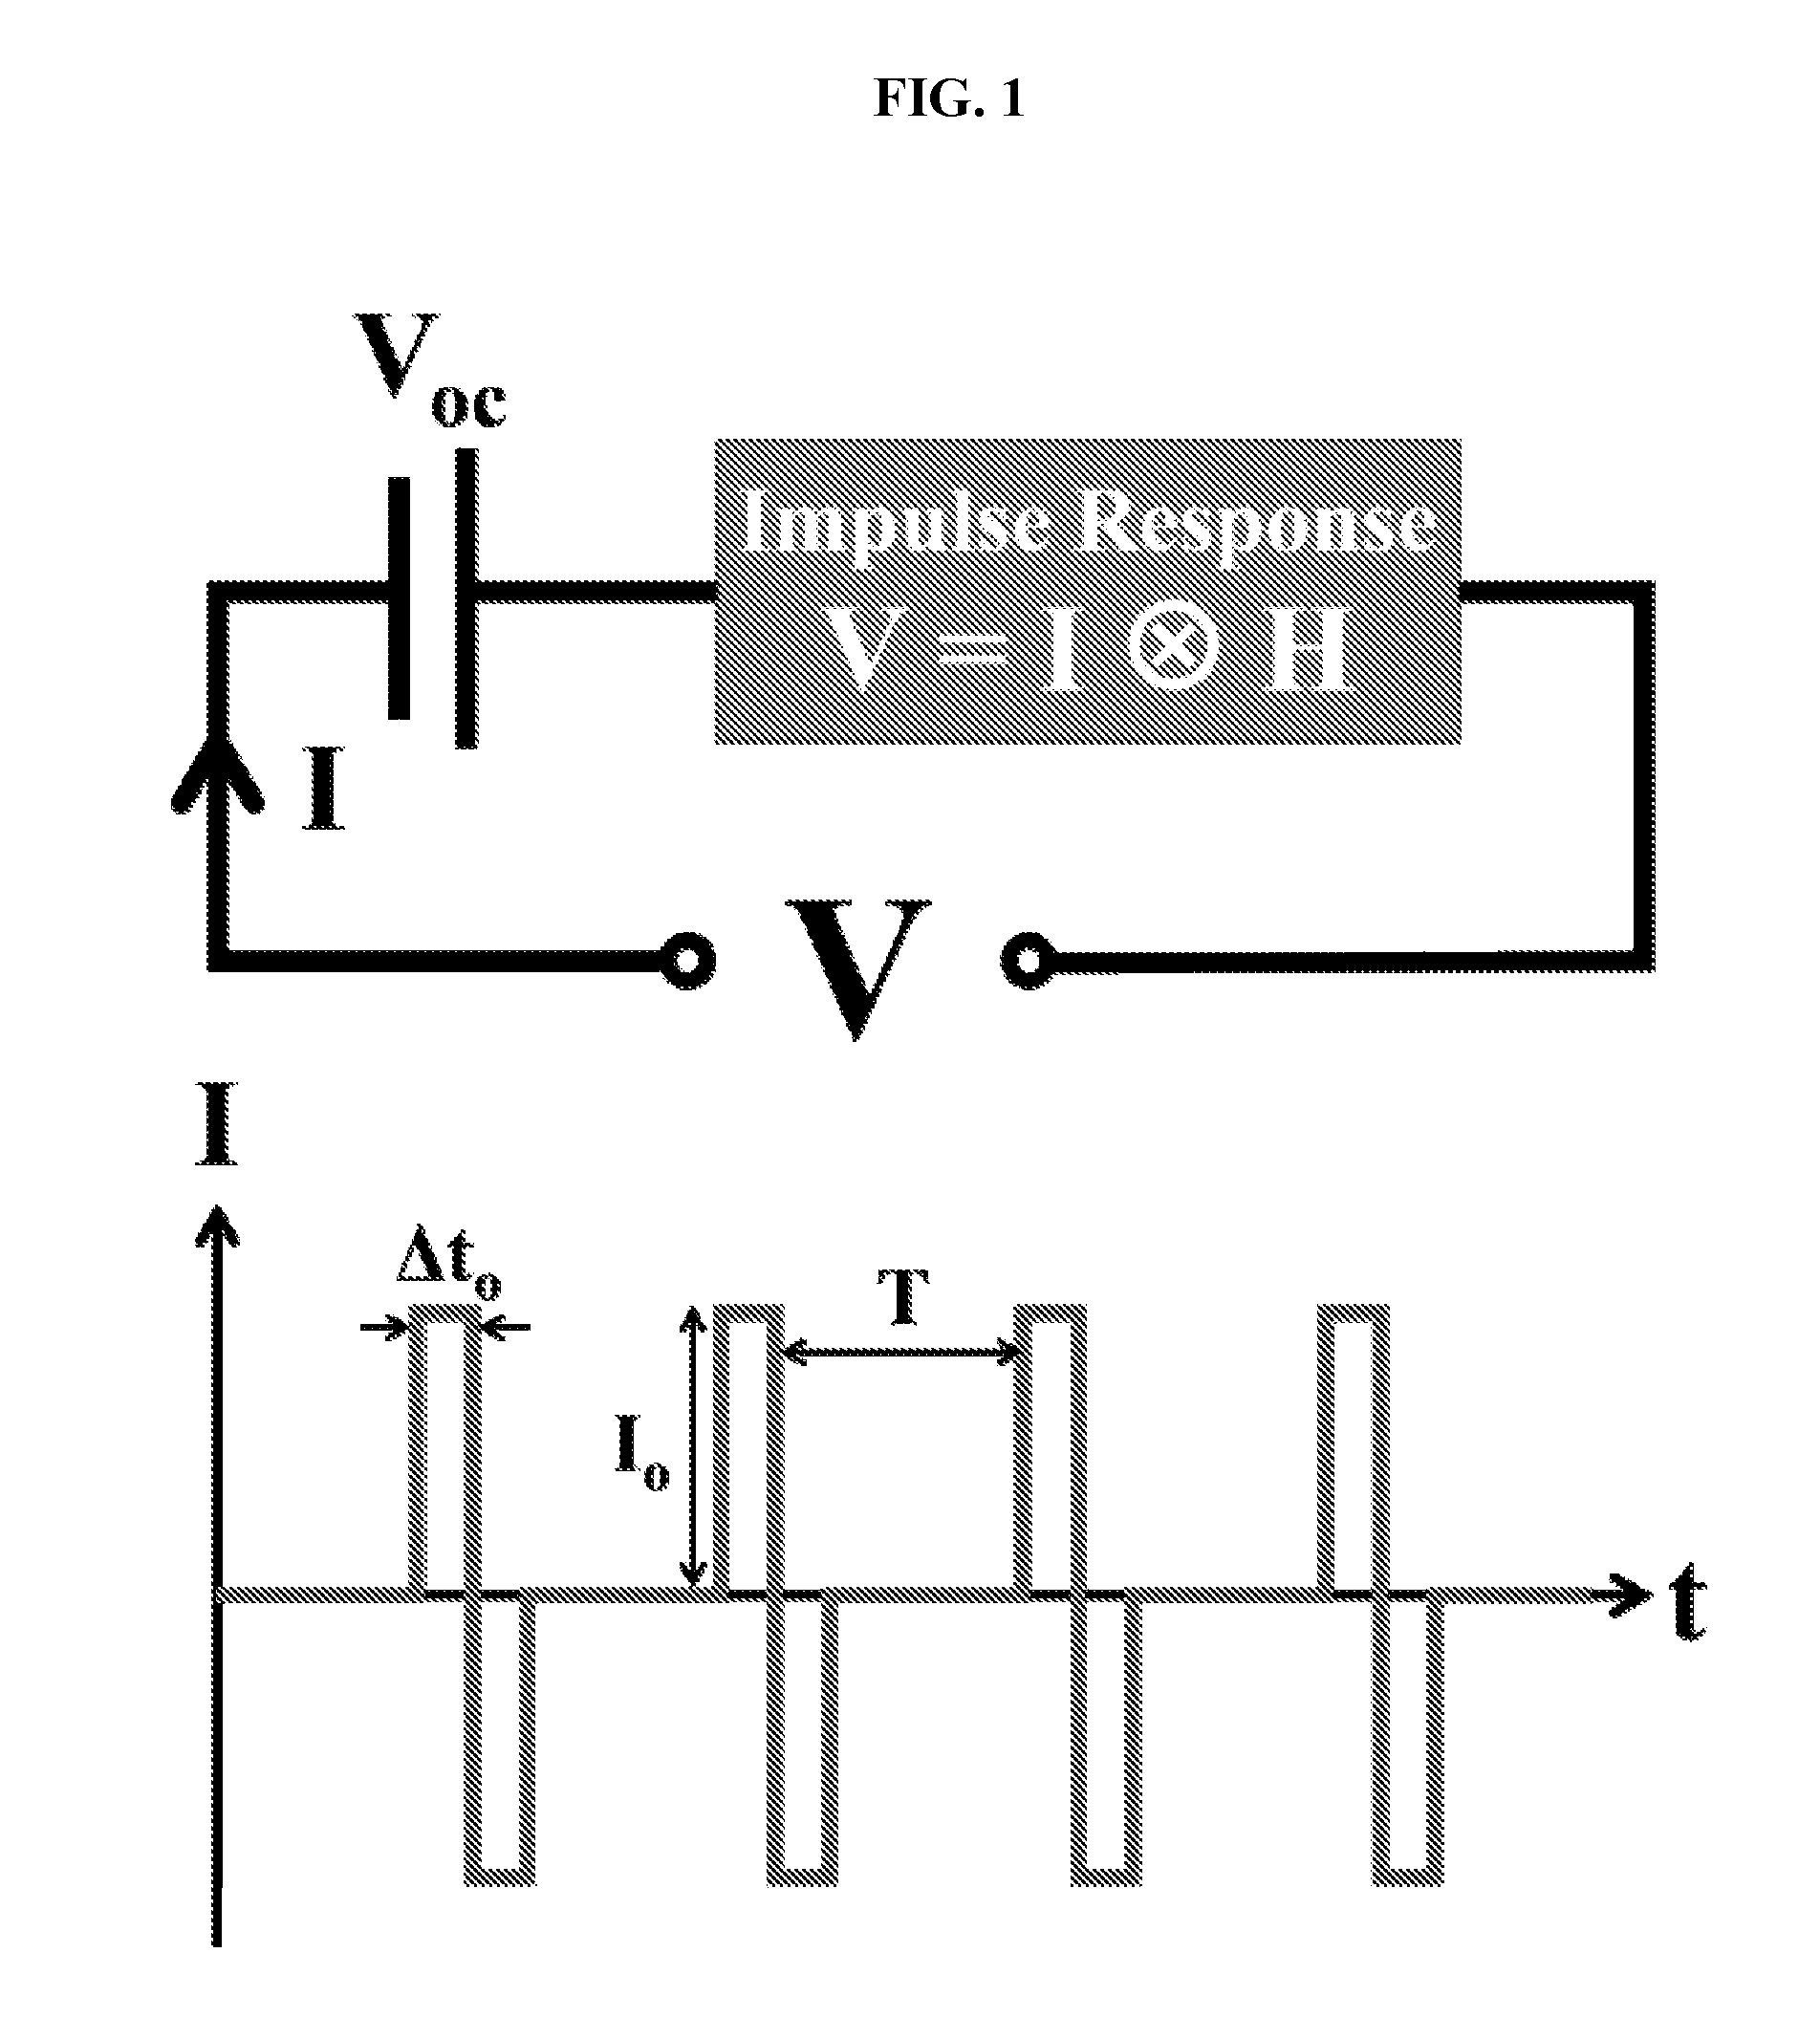
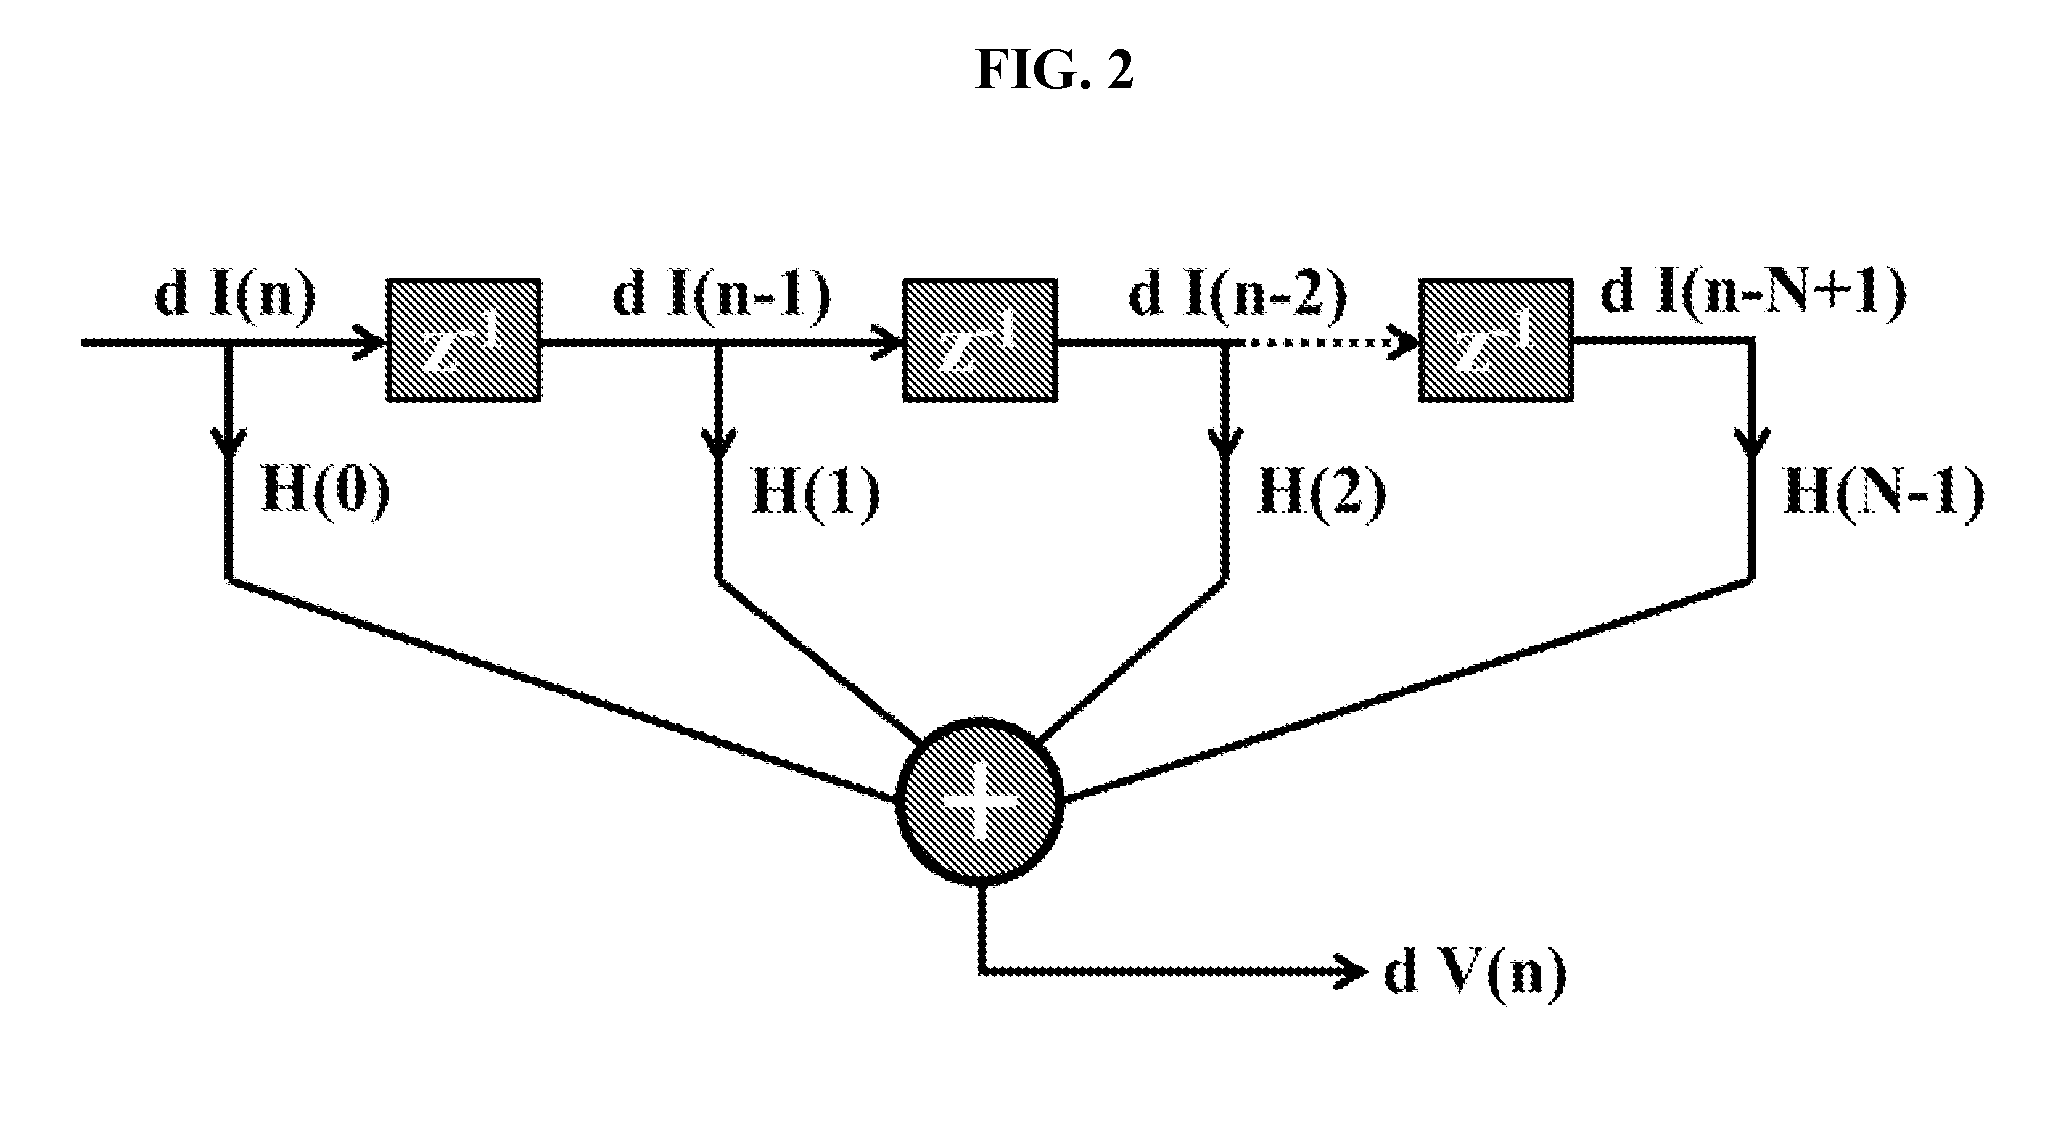
Double-pulse technique for on-line diagnostics of electrochemical systems
a technology of electrochemical systems and double pulses, applied in the field of real-time characterization of electrochemical systems, can solve the problems of difficult on-line characterization of batteries or fuel cells in vehicles, short simulation time, and low computation cos
- Summary
- Abstract
- Description
- Claims
- Application Information
AI Technical Summary
Benefits of technology
Problems solved by technology
Method used
Image
Examples
example 1
Experimental Demonstration of Battery Diagnostics with a Double-Pulse Profile—Real-Time Acquisition of Impulse Response
[0187]The lithium-ion battery is driven using a driving sequence repeated six times, as shown in FIG. 5A. This sequence includes a rest (98 seconds), a discharge pulse (1 second at −300 W), and a charge pulse (1 second at 300 W) at an input rate of 0.25 seconds. After the sixth sequence is applied, the battery is allowed to rest for a further 12 seconds to let it relax.
[0188]FIG. 5 demonstrates real-time acquisition of H(t) based on the measured I, V data, by driving the battery with a series of charge-discharge pulses at room temperature. The I(t) and V(t) data, shown in FIG. 5A, are then used to solve H(t) of the FIR implementation via a Kalman filter. The regressed H(t) function, shown in FIG. 5B, is then Fast-Fourier-transformed to obtain H(z). FIG. 5C shows the magnitude (top graph) and phase (bottom graph) plots for H(z). FIG. 5D shows the Nyquist plot for H(z...
example 2
Experimental Demonstration of Battery Diagnostics with a Double-Pulse Profile—Signal Improvement with Number of Pulses
[0190]These experiments are performed at room temperature with a starting state-of-charge (SOC) of 30%. The driving profile pulse sequence consists of a rest of 98 seconds, followed by a −50 A discharge pulse of 1 second, followed by a 50 A charge pulse of 1 second.
[0191]FIG. 6 demonstrates the improvement of the signal-to-noise ratio of H(t) as the number of pulses for H(t) regression is increased. In each plot, the H(t) function is plotted in addition to the magnitude, phase, and Nyquist plots for the H(z) function. In particular, FIG. 6A shows the impulse response H(t) (left-hand graph), the magnitude of H(z) (top-middle graph), the phase of H(z) (bottom-middle graph), and the Nyquist plot for the H(z) function (right graph) for 1 repetition of the pulse sequence. FIGS. 6B, 6C, and 6D show the same information for 5, 10, and 15 repetitions of the pulse sequence, r...
example 3
Experimental Demonstration of Battery Diagnostics with a Double-Pulse Profile—Battery Kinetics at Different Temperatures
[0192]These experiments are performed with a starting SOC of 60% and different environmental temperatures. The driving profile pulse sequence consists of a rest of 98 seconds, followed by a −50 A discharge pulse of 1 second, followed by a 50 A charge pulse of 1 second.
[0193]The temperatures tested are 10° C. (FIG. 7A), 15° C. (FIG. 7B), 25° C. (FIG. 7C), and 30° C. (FIG. 7D). In each plot, the H(t) function is plotted in addition to the magnitude, phase, and Nyquist plots for the H(z) function. In particular, FIG. 7A shows the impulse response H(t) (left-hand graph), the magnitude of H(z) (top-middle graph), the phase of H(z) (bottom-middle graph), and the Nyquist plot for the H(z) function (right graph) for a 10° C. environmental temperature. FIGS. 7B, 7C, and 7D show the same information for 15° C., 25° C., and 30° C., respectively.
[0194]FIG. 7 demonstrates a dra...
PUM
 Abstract
Description
Claims
Application Information
 - R&D
- Intellectual Property
- Life Sciences
- Materials
- Tech Scout
- Unparalleled Data Quality
- Higher Quality Content
- 60% Fewer Hallucinations
Browse by: Latest US Patents, China's latest patents, Technical Efficacy Thesaurus, Application Domain, Technology Topic, Popular Technical Reports.
© 2025 PatSnap. All rights reserved.Legal|Privacy policy|Modern Slavery Act Transparency Statement|Sitemap|About US| Contact US: help@patsnap.com


