Method for operating and maintaining chart display of worksheet

A worksheet and chart technology, applied in software maintenance/management, special data processing applications, instruments, etc., can solve the problems of a large number of code development, large consumption of human resources, and long development cycle.

Inactive Publication Date: 2018-02-09
北京数猎天下科技有限公司
View PDF2 Cites 1 Cited by
  • Summary
  • Abstract
  • Description
  • Claims
  • Application Information

AI Technical Summary

Problems solved by technology

[0005] This method requires developers to have high professional knowledge, and requires a lot of code development, consumes a lot of human resources, and the development cycle is long
In addition, drawing charts for the same worksheet or even different statistical analysis data of the same dimension requires separate development of interfaces. A large number of repeated developments cause waste of human resources, and later maintenance is also very difficult

Method used


Image

  • Method for operating and maintaining chart display of worksheet
  • Method for operating and maintaining chart display of worksheet
  • Method for operating and maintaining chart display of worksheet

Examples


Embodiment Construction

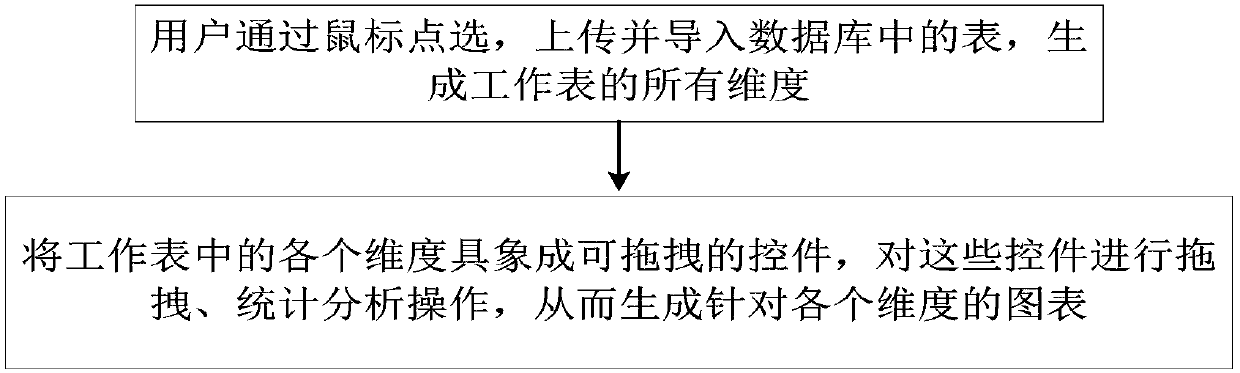
[0021] Such as figure 1 As shown, the method for operating and maintaining the chart display of the worksheet includes the following steps:

[0022] (1) The user clicks with the mouse, uploads and imports the table in the database, and generates all the dimensions of the worksheet;

[0023] (2) Represent each dimension in the worksheet as a draggable control, and perform dragging and statistical analysis operations on these controls to generate charts for each dimension.

[0024] In the present invention, the user only needs to click with the mouse, upload and import the table in the database, and the system can generate all the dimensions of the worksheet, visualize each dimension in the worksheet as draggable controls, and drag and drop these controls. Statistical analysis operations to generate charts for each dimension, so it can provide a set of simple and intuitive graphical operation interface for non-database professionals. Users can also operate and maintain the char...


PUM


Abstract

The invention discloses a method for operating and maintaining the chart display of a worksheet, and can provide one set of convenient and visual graphical operation interface for non-database professionals. A user can operate and maintain the chart display of the worksheet under a situation that the user does not have programming foundations, and the method can be widely applied to the data visual display of each industry, and can assist the user in carrying out the character display of different dimensions on the worksheet according to own requirements. The method comprises the following steps that: (1) the user clicks through a mouse, uploads and imports a chart in the database and generates all dimensions of the worksheet; and (2) each dimension in the worksheet is concretized into controls capable of being dragged, and the controls can be subjected to dragging and statistic analysis operations so as to generate the chart which aims at each dimension.

Description

technical field [0001] The invention relates to the technical field of big data visualization, and in particular to a method for operating and maintaining a graph display of a worksheet, and a system for operating and maintaining the graph display of a worksheet. Background technique [0002] With the in-depth business integration of computer application systems in various industries, the resulting data from various sources is also accumulating day by day. Therefore, data visualization is becoming more and more important for industry analysis, and accuracy is increasingly required. [0003] The industry needs to draw a large number of charts for the data, and the information analysis obtained from the charts drawn in different dimensions in the same worksheet is different. For drawing charts of different dimensions of the worksheet, the following modes are roughly required at present: [0004] Employ computer database professionals to provide front-end structured data to th...

Claims


Application Information

Patent Timeline
Patent Type & Authority Applications(China)
IPC IPC(8): G06F17/24G06F8/70
CPCG06F8/70G06F40/18G06F40/183
Inventor 孙辉程凯征
Owner 北京数猎天下科技有限公司
Why Eureka
Try Eureka