
A 3D Display Method of 2D Seismic Section

A technology for seismic profile and 3D display, which is applied in image data processing, 3D image processing, 3D modeling, etc.

Active Publication Date: 2018-06-12
BEIJING UNIV OF TECH
View PDF3 Cites 0 Cited by
  • Summary
  • Abstract
  • Description
  • Claims
  • Application Information

AI Technical Summary

Problems solved by technology

[0005] In view of this, the present invention proposes and realizes a three-dimensional display method of two-dimensional seismic data to solve the problems existing in the prior art, such as poor ability to display seismic microstructure and not intuitive enough

Method used


Image

  • A 3D Display Method of 2D Seismic Section
  • A 3D Display Method of 2D Seismic Section
  • A 3D Display Method of 2D Seismic Section

Examples


Embodiment Construction

[0089] The present invention will be further described below in conjunction with the accompanying drawings and embodiments.

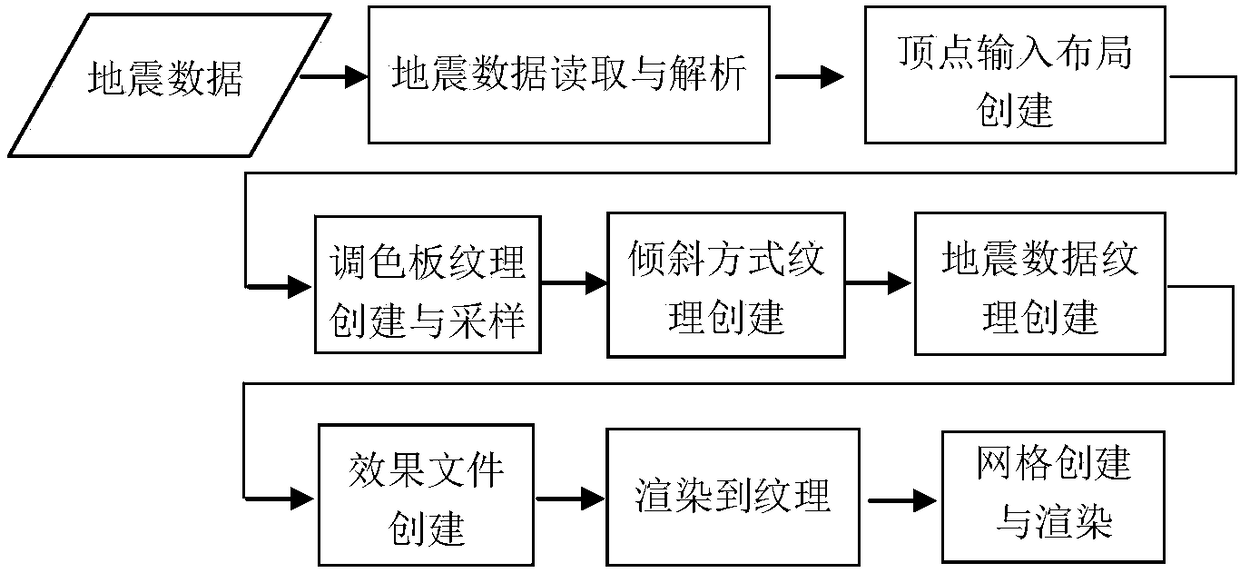
[0090] The flowchart of the method of the present invention is as figure 1 As shown, it specifically includes the following steps:

[0091] Step 1: Seismic data reading and analysis, use S(x, y) to represent the read seismic data in the standard segy format, (x, y) represents the two-dimensional coordinates of the sample point in the seismic section, and x and y are Non-negative integer, the range of the seismic section to be displayed is (j 0 , i 0 ) is the w track and h sample points of the starting point, considering that the window size is 5 and the sliding range of the window is (-1, 1), so the value range of x and y is j 0 ≤x≤j 0 +w-1, i 0 -3≤y≤i 0 +h+2, after determining the size of the seismic data to be displayed, you can determine the size of the window. In this embodiment, the 400×300 sample point data starting from the 1400th track an...


PUM


Abstract

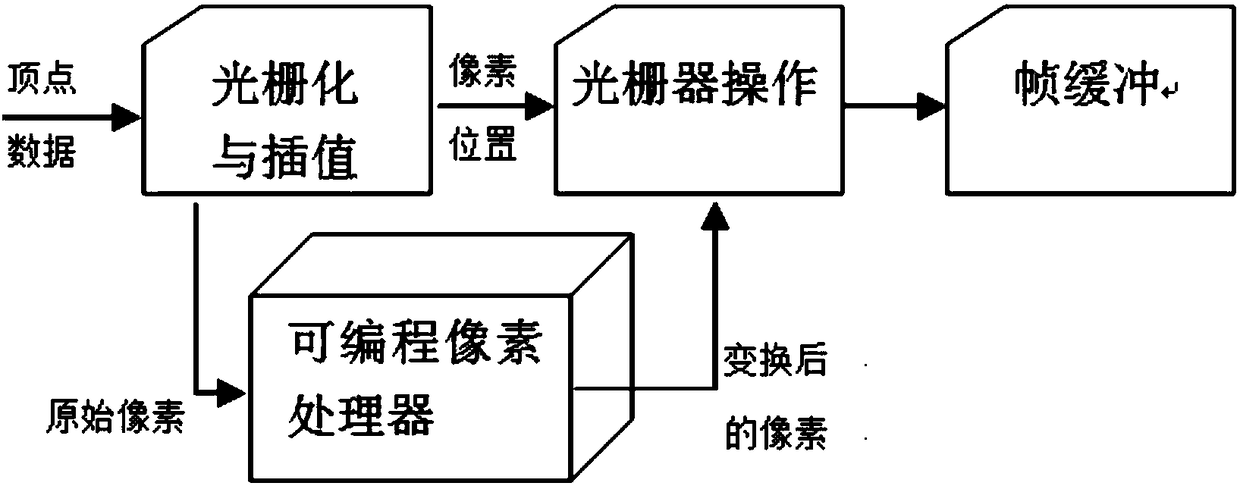
A method for three-dimensional display of a two-dimensional earthquake profile is disclosed. The method includes reading earthquake profile data from a disc and converting the earthquake profile data into a coding format used by the system. The method further includes vertex input layout establishment including earthquake data vertex input layout establishment and rendering and texture vertex input layout establishment, palette texture establishing and sampling, inclined texture establishing, i.e. rendering object while rendering texture, establishing earthquake data texture for storing earthquake data, creating effect files including creating a rendering to texture effect file and a rendering output effect file, rendering to texture, rendering numeralized earthquake sampling points to texture in an inclined way and creating a grid, and creating, rendering and outputting the earthquake data grid. Earthquake data are sent to a GPU through a floating point texture means, and accurate coloring of earthquake data vertexes and accurate pixel interpolation between vertexes are realized. A pallet is created in an index progressive way, the display contrast of an earthquake profile is improved, and three-dimensional display of a two-dimensional earthquake profile is realized.

Description

technical field [0001] The invention relates to the fields of computer graphics and scientific visualization, and more specifically relates to a three-dimensional display method of a two-dimensional seismic section. Background technique [0002] The display technology of seismic data plays a key role in the interpretation of seismic data in seismic exploration. An intuitive, correct, and well-defined seismic display can greatly facilitate geological researchers to make accurate analysis of relevant data and draw correct conclusions, which has important practical significance for oil and gas exploration, geological exploration and other fields. [0003] The existing seismic data display technologies are mainly divided into two categories: one is two-dimensional display; the other is three-dimensional display. Two-dimensional display of seismic data is a technology for displaying seismic section data in a two-dimensional image, which can be divided into four categories: wavef...

Claims


Application Information

Patent Timeline
Patent Type & Authority Patents(China)
IPC IPC(8): G06T17/05G06T15/04
Inventor 陈雷禹晶肖创柏
Owner BEIJING UNIV OF TECH
Learn More