
Dynamic Screening and Comprehensive Weight Setting Method of Analysis Index of Line Loss Rate in Low Voltage Station Area

A low-voltage station area and comprehensive weight technology, which is applied in special data processing applications, instruments, electrical digital data processing, etc., can solve the problems of one-sided index weight, heavy workload, lack of scientificity, etc., and achieve improved working mode and high precision The effect of the analysis

Active Publication Date: 2018-05-15
SOUTH CHINA UNIV OF TECH
View PDF4 Cites 0 Cited by
  • Summary
  • Abstract
  • Description
  • Claims
  • Application Information

AI Technical Summary

Problems solved by technology

The existing work on the line loss rate in low-voltage station areas is mainly to collect all indicators and summarize the data one by one. The workload is large and redundant, and it is easily affected by dogma or empiricism
The limitations of the existing analysis methods for line loss rate indicators in low-voltage station areas are as follows: 1) The process of index screening and analysis is subjective and lacks systematic standards; 2) The analysis process of high-dimensional indicators is cumbersome and inefficient. There are common errors and omissions, and it is difficult to conduct a comprehensive and large-scale comprehensive analysis and evaluation of the line loss rate in low-voltage station areas; 3) The decision-making method for index selection is not flexible, and the selected index dimensions are not only constrained by static manual methods, but also Lack of scientificity; 4) For the selected indicators, their representativeness and practical value cannot be determined; 5) The indicator weight of the line loss rate in the low-voltage station area is one-sided, which reduces the accuracy of the calculation results

Method used


Image

  • Dynamic Screening and Comprehensive Weight Setting Method of Analysis Index of Line Loss Rate in Low Voltage Station Area
  • Dynamic Screening and Comprehensive Weight Setting Method of Analysis Index of Line Loss Rate in Low Voltage Station Area
  • Dynamic Screening and Comprehensive Weight Setting Method of Analysis Index of Line Loss Rate in Low Voltage Station Area

Examples


Embodiment Construction

[0052] The present invention will be further described in detail below in conjunction with the embodiments and the accompanying drawings, but the embodiments of the present invention are not limited thereto.

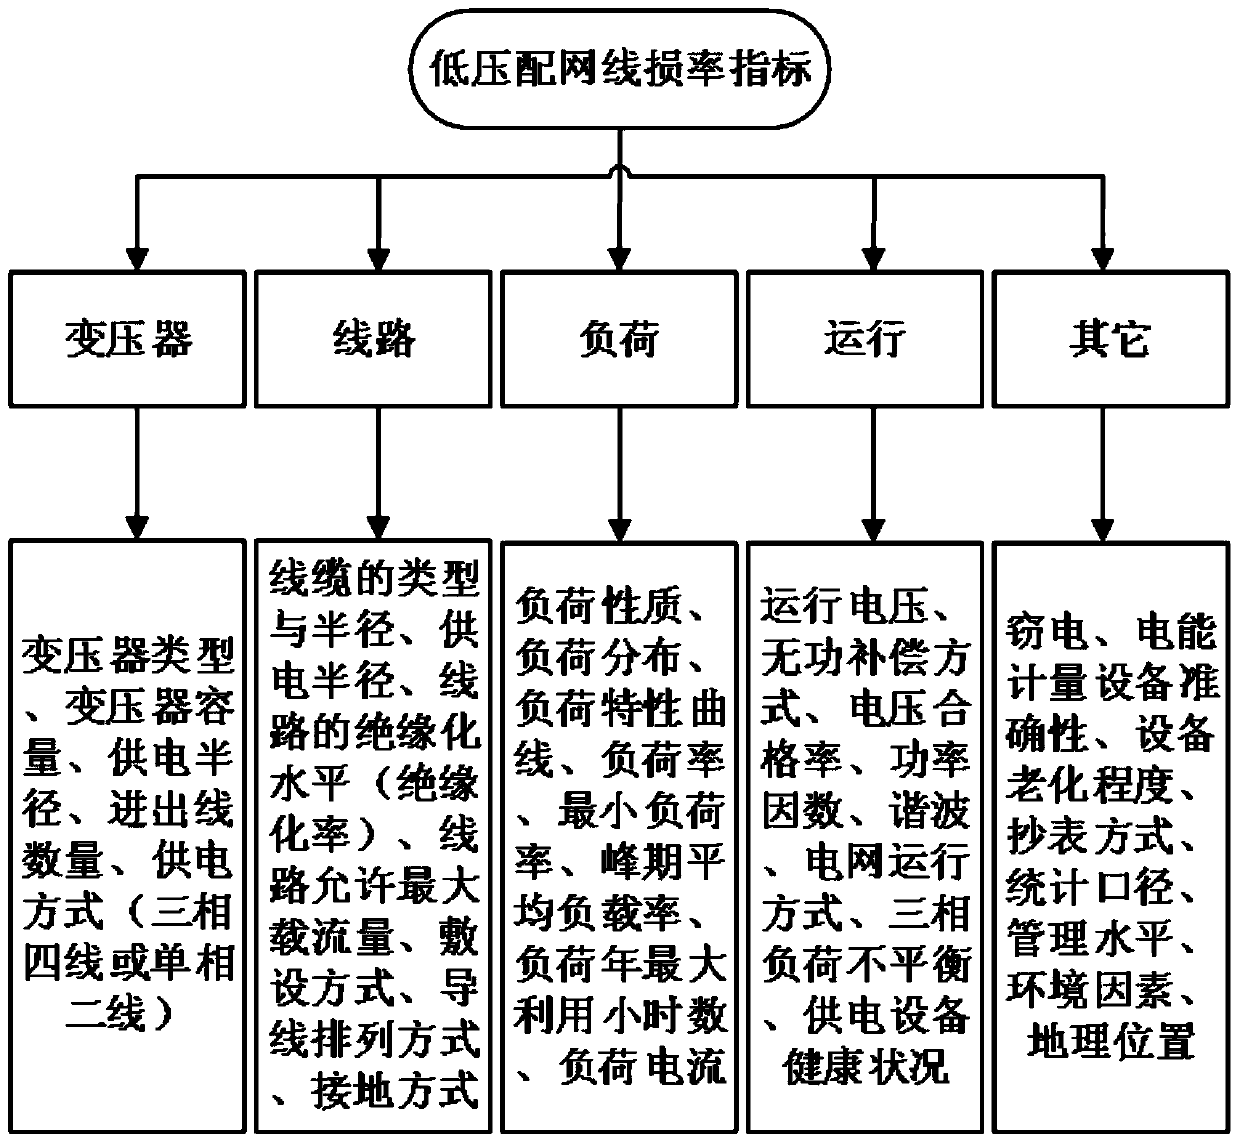
[0053] attached figure 1 It is a comprehensive indicator system map (first-level index system map) of line loss rate in low-voltage station area, which is obtained through comprehensive collection and summarization from multiple angles, and a preliminary system division is carried out according to expert experience;

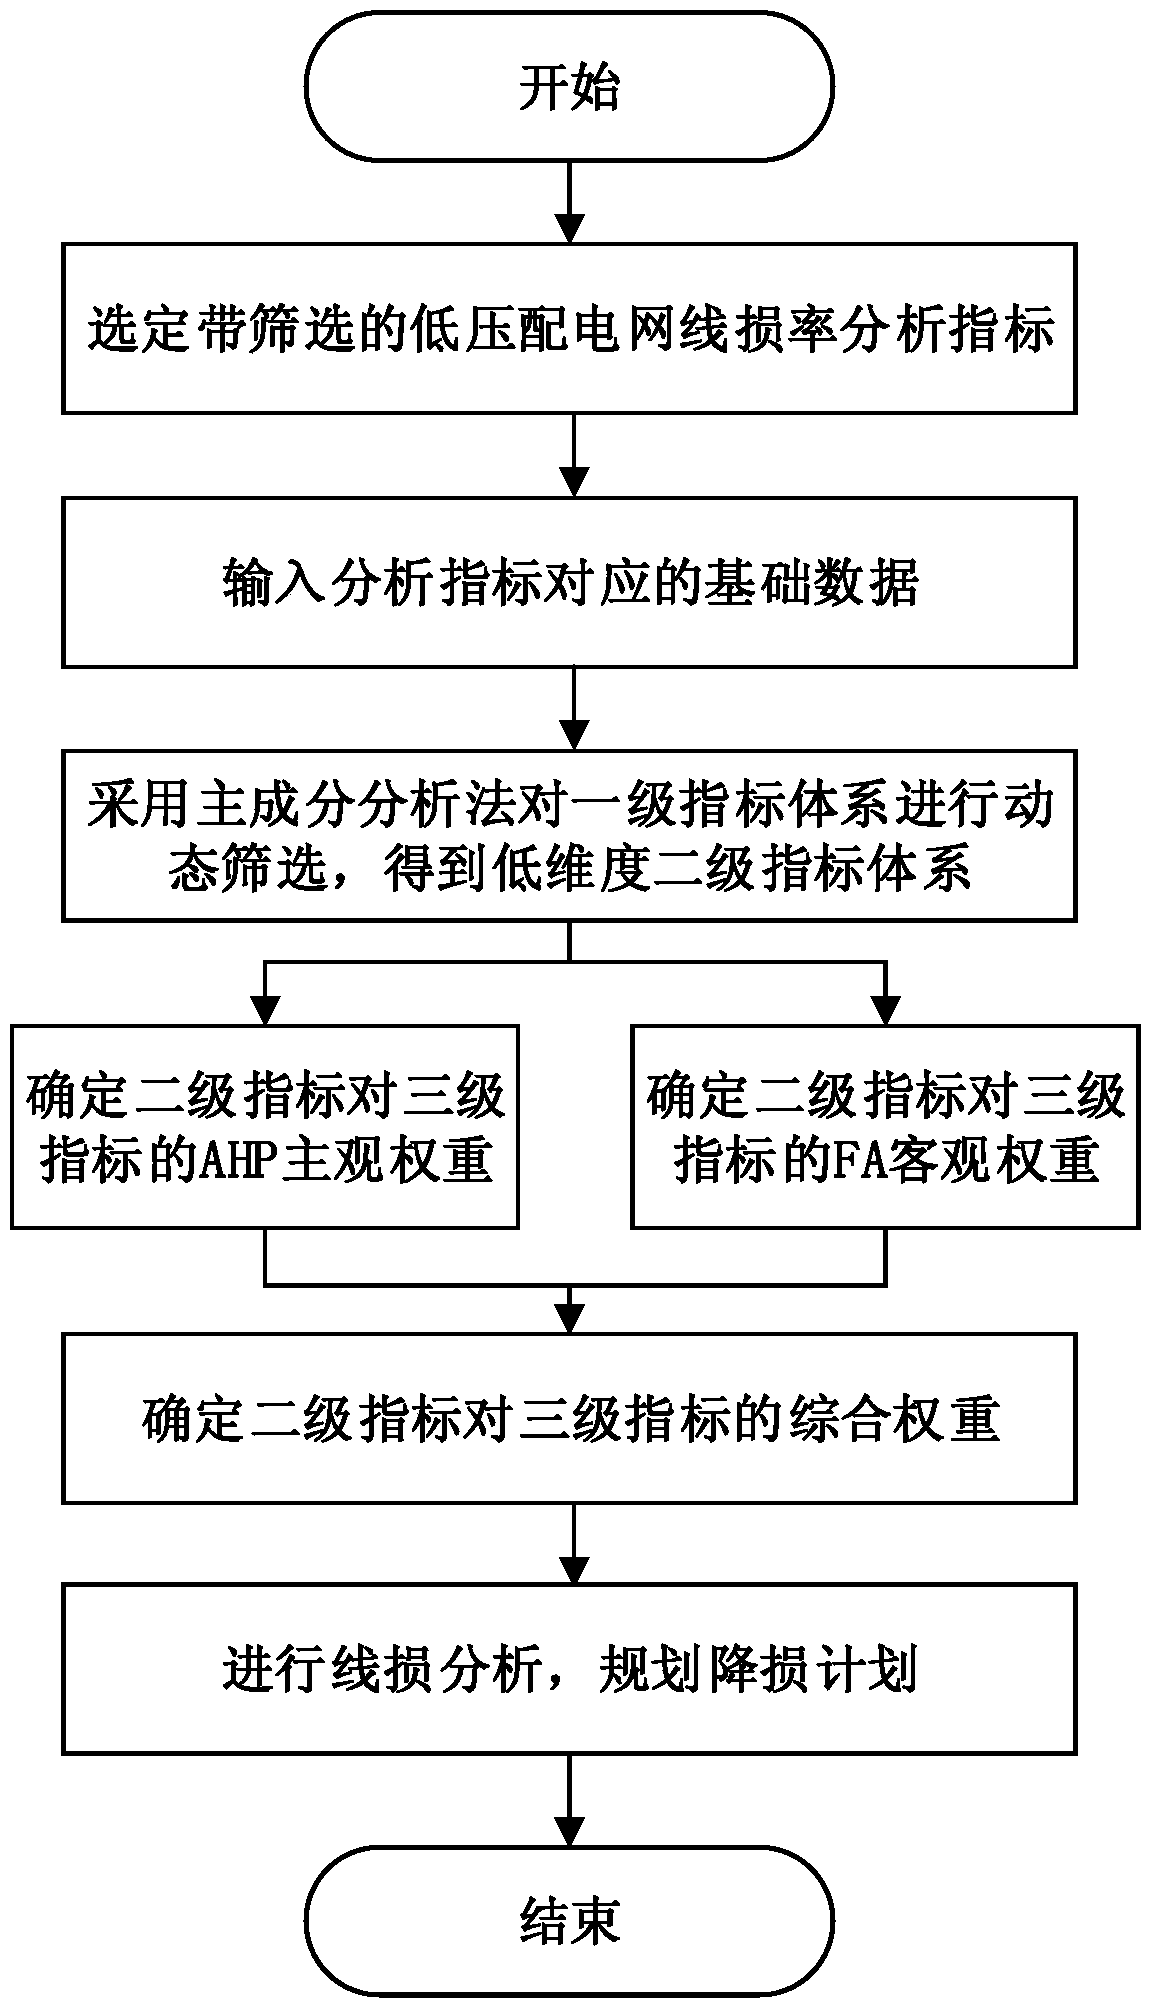
[0054] attached figure 2 It is a working flow chart of the dynamic screening and comprehensive weight setting method of the line loss rate analysis index in the low-voltage station area of ​​the present invention. The basic content is:

[0055] First of all, it is necessary to input the index data of the line loss rate in the low-voltage station area to be screened, and select the first-level index as the dynamic screening object based on the comprehensiv...


PUM


Abstract

The invention discloses a method for dynamic screening and comprehensive weight setting of line loss rate analysis indicators in low-voltage station areas, including the following steps: collecting and summarizing the analysis indicators of line loss rate in low-voltage station areas, and establishing a first-level index system for line loss rate in low-voltage station areas ; Use the principal component analysis method to dynamically screen the first-level index system, screen out the low-dimensional second-level index system of the line loss rate of the low-voltage station area, and use the line loss rate of the low-voltage station area as the third-level index to obtain the line loss rate of the low-voltage station area A three-level dynamic index system; using AHP-factor analysis to obtain the comprehensive weight of the second-level indicators to the third-level indicators in the dynamic index system, and evaluate the impact of each second-level indicator on the low-voltage station area line based on the obtained comprehensive weight. Contribution rate to the loss rate. The method of the present invention, on the one hand, provides a reference basis for the power supply enterprise to analyze the line loss rate of the low-voltage distribution network; in addition, the contribution rate of the index to the line loss rate is evaluated, which is beneficial to assist the power supply enterprise to carry out a targeted analysis of the line loss rate of the low-voltage distribution network governance and transformation.

Description

technical field [0001] The invention relates to the field of line loss rate analysis in low-voltage station areas of electric power systems, in particular to a method for dynamically screening line loss rate analysis indicators in low-voltage station areas and setting comprehensive weights. Background technique [0002] The low-voltage station area is the end link directly facing the user in the power system, and its line loss rate is directly related to the economic benefits of the power supply company and the user. At this stage, the analysis of the line loss rate of the low-voltage station area has become the key to the power supply company's promotion of energy conservation and emission reduction question. However, the system that affects the line loss rate indicators of low-voltage station areas is huge and complex. For local power supply companies and researchers, there are a large number of low-voltage station areas in the area under their jurisdiction. The line loss...

Claims


Application Information

Patent Timeline
Patent Type & Authority Patents(China)
IPC IPC(8): G06F19/00
Inventor 欧阳森安晓华
Owner SOUTH CHINA UNIV OF TECH
Learn More