
Understanding the relationship between cause and effect is essential in research. This is where explanatory vs. response variable comes into play. Identifying these variables correctly helps researchers analyze data effectively, make accurate predictions, and establish meaningful conclusions.
This guide explores:
- What explanatory and response variables are
- How to differentiate them in research studies
- Examples across various fields
- How AI-powered tools like Eureka improve research accuracy
What Are Explanatory and Response Variables?
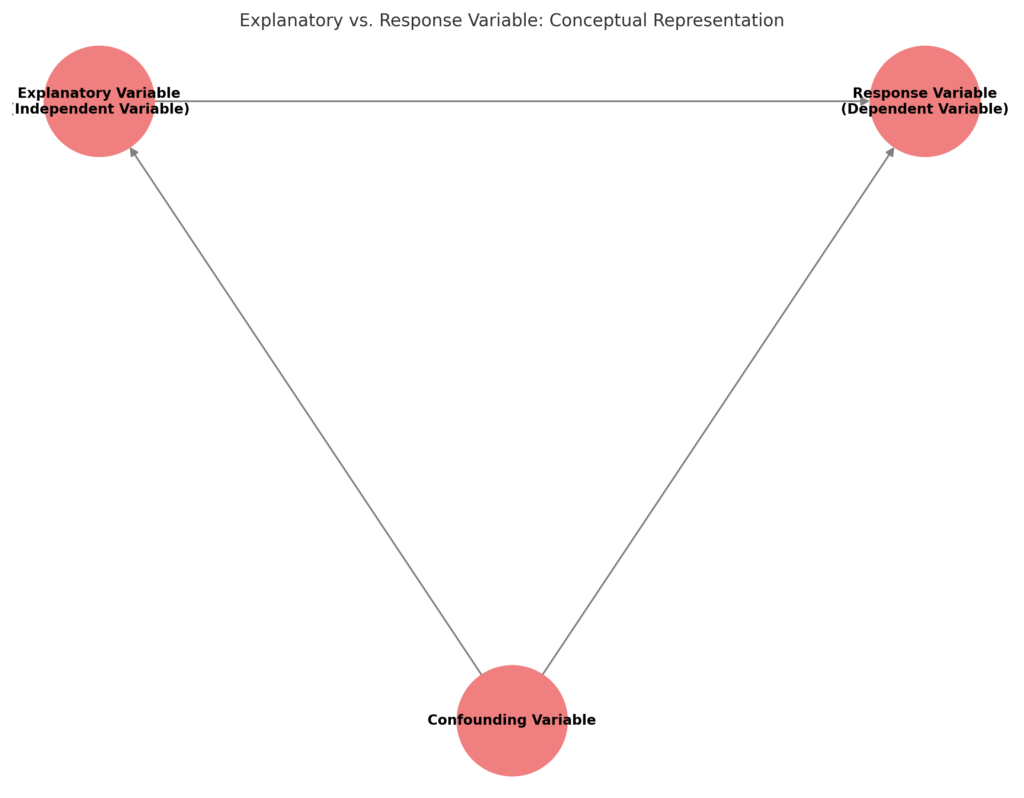
🔹 Explanatory Variable (Independent Variable)
The explanatory variable is the one that influences or explains changes in another variable. It is also known as the independent variable because researchers manipulate or observe it to see its effect on the response variable. The primary role of explanatory variables is to provide information that helps in understanding the relationship between different variables. Researchers control or observe these variables to see how they affect the response variable.
📌 Example:
In a study measuring the effect of exercise on weight loss:
- Exercise level (hours per week) = Explanatory variable
🔹 Response Variable (Dependent Variable)
The response variable is the outcome being measured. It is also known as the dependent variable because its value depends on changes in the explanatory variable. The response variable indicates the effect or result of the explanatory variables. It is the variable that the researcher is trying to explain or predict.
📌 Example:
Using the exercise and weight loss study:
- Weight loss (in pounds) = Response variable
✅ Key Relationship: The explanatory variable causes changes in the response variable.
Curious about explanatory and response variables? Eureka Technical Q&A provides expert insights into their roles in statistical analysis, helping you understand how to identify, interpret, and use them effectively in research and data modeling.

Identifying Variables in Different Types of Research
1️⃣ Experimental Research
✅ Researchers actively manipulate the explanatory variable to see its effect on the response variable.
📌 Example: A drug trial tests how dosage levels (explanatory variable) affect blood pressure reduction (response variable).
🔍 How Eureka Helps:
AI-powered data modeling in Eureka predicts optimal dosage levels for clinical research.
2️⃣ Observational Research
✅ Researchers do not manipulate variables but observe natural relationships.
📌 Example: Studying how screen time (explanatory variable) affects sleep quality (response variable) in teenagers.
🔍 How Eureka Helps:
Eureka’s pattern recognition technology detects hidden correlations in large datasets.
3️⃣ Predictive Modeling
✅ Explanatory variables are used to forecast future response variables.
📌 Example: A business predicts sales revenue (response variable) based on advertising spend (explanatory variable).
🔍 How Eureka Helps:
AI-driven market trend analysis in Eureka optimizes advertising strategies for better sales predictions.
Common Mistakes When Identifying Variables
❌ Confusing Correlation with Causation
📌 Example: Higher ice cream sales are correlated with more swimming pool drownings, but ice cream does not cause drownings. The true explanatory variable is hot weather.
❌ Choosing the Wrong Explanatory Variable
📌 Example: A study examines how coffee consumption affects productivity, but a better explanatory variable might be caffeine intake rather than just coffee consumption.
🔍 Eureka’s Solution: Eureka’s predictive analysis determines which variables truly drive response changes.

Steps to Identify Explanatory vs. Response Variable
🔹 Step 1: Define Your Research Question
Begin by clearly defining the research question or hypothesis you want to investigate. This will guide you in determining which variable you want to explain (response variable) and which variables you will use to explain it (explanatory variables).
📌 Example: “Does social media usage affect mental well-being?”
🔹 Step 2: Identify the Suspected Cause (Explanatory Variable)
- Response Variable: This is the variable you want to predict or explain. It is usually the outcome or dependent variable in your study.
- Explanatory Variables: These are the variables that you believe can explain or predict the response variable. They are often independent variables in your analysis.
📌 Example: Hours spent on social media per day
🔹 Step 3: Data Understanding
Thoroughly understand the data you have. This includes knowing the variables available, their measurements, and any relationships that might be apparent from initial data exploration.
📌 Example: Self-reported stress levels
🔹 Step 4: Choose a Research Design
Decide whether to conduct an experiment, observational study, or predictive analysis.
📌 Example: Using a longitudinal study to track mental health changes over time.
🔹 Step 5: Use AI for Data Validation
Ensure the correct variables are chosen using Eureka’s AI-driven validation tools.
📌 Example: Eureka detects hidden biases or misclassified variables in large datasets.
How Eureka Enhances Variable Selection and Analysis

🔍 What is Eureka?
Eureka by PatSnap is an AI-powered research intelligence tool that helps researchers:
- Identify key explanatory variables
- Analyze global trends in cause-and-effect relationships
- Improve research accuracy with real-time data validation
🔍 How Eureka Helps Researchers
- Detects hidden patterns – AI uncovers unseen relationships between variables.
- Automates causation analysis – Differentiates between correlation and causation.
- Optimizes experimental design – Suggests ideal variable selection for better accuracy.
- Reduces bias in observational research – Flags sampling errors and confounding variables.
📌 Example of Eureka in Action:
A medical research team studying the effects of diet on cholesterol levels can:
- Use AI to identify the most influential dietary factors.
- Compare global research trends to validate their findings.
- Automatically test cause-and-effect relationships using machine learning.
Conclusion
Understanding explanatory vs. response variables is essential for drawing accurate research conclusions. Whether conducting experimental studies, observational research, or predictive modeling, correctly identifying variables ensures valid and reliable findings.
🚀 Eureka enhances research by:
- Improving variable selection with AI-driven analysis
- Detecting bias and confounding variables
- Automating statistical validation for cause-and-effect relationships
🔍 Want to improve your research accuracy? Explore Eureka today and unlock AI-powered insights to refine your study design!
FAQs
1️⃣ What is the main difference between an explanatory and response variable?
✅ Explanatory variable causes or predicts a change, while the response variable is the outcome being measured.
2️⃣ How do I know if I’ve chosen the correct explanatory variable?
✅ Use statistical tests like regression analysis or AI-powered tools like Eureka to detect causal relationships.
3️⃣ Can a variable be both explanatory and response in different studies?
✅ Yes! In one study, education level may be an explanatory variable (predicting income), while in another, it may be a response variable (influenced by parental support).
4️⃣ How does AI help in selecting the right variables?
✅ AI-powered tools like Eureka analyze global datasets, detect hidden biases, and optimize research designs to enhance study accuracy.
5️⃣ Can explanatory and response variables change in experimental vs. observational research?
✅ Yes! In experiments, researchers manipulate the explanatory variable, while in observational studies, they simply observe existing relationships.
To get detailed scientific explanations of Explanatory vs. Response Variable, try Patsnap Eureka.